 13
13peptides
spectra
0.904 | 0.936
0.000 | 0.000
0.000 | 0.010
0.000 | 0.000
0.000 | 0.000
0.000 | 0.000
0.060 | 0.087
0.000 | 0.000
| Plot | Mito | Lyso | Perox | ER | Golgi | PM | Cytosol | Nucleus | |||||
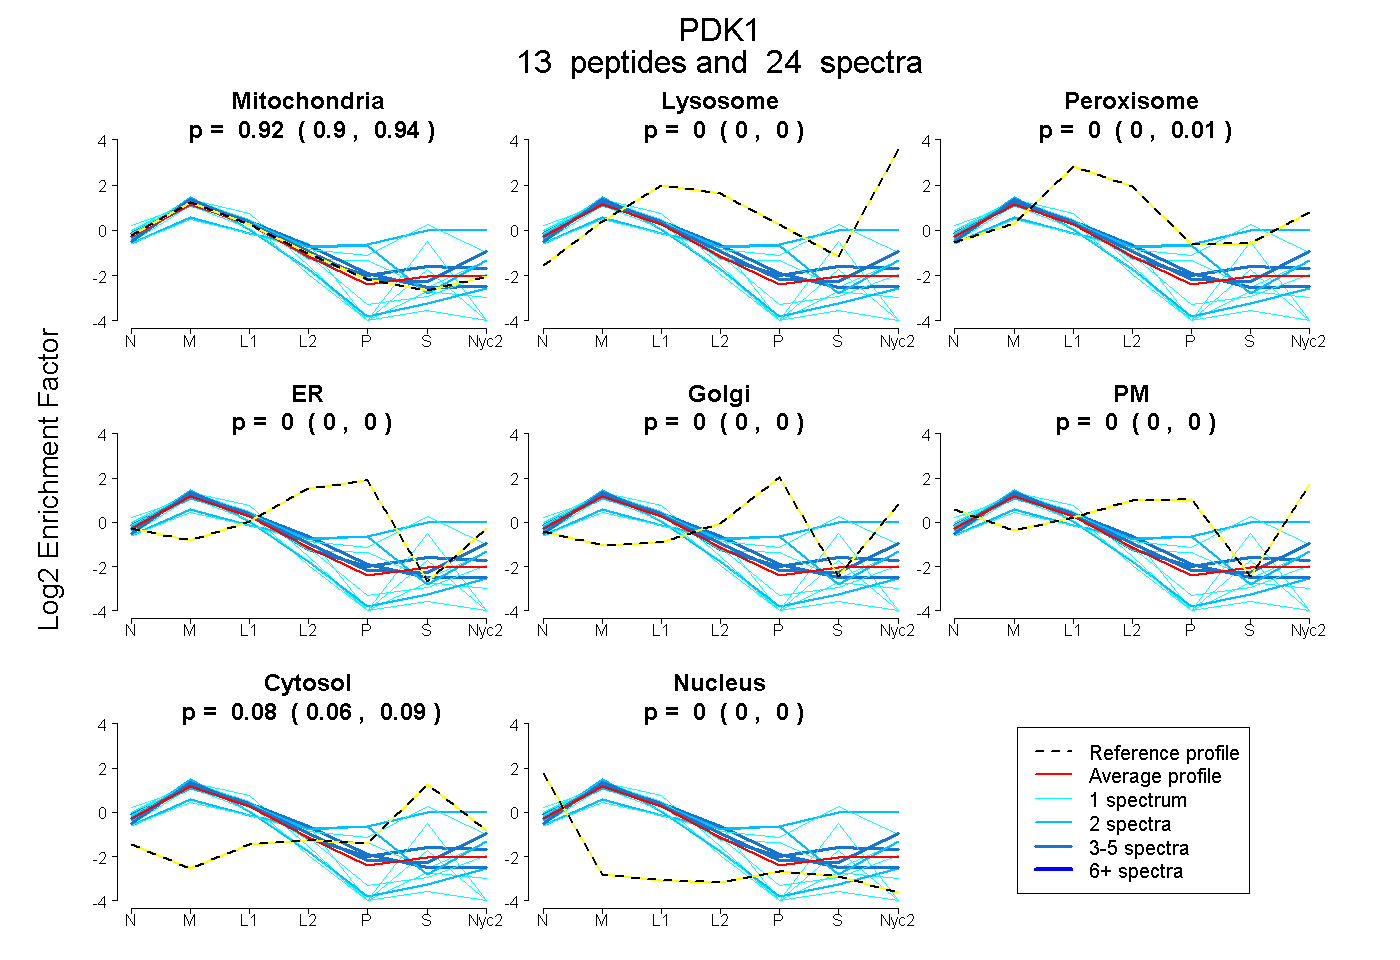
| Expt A |
13 peptides |
24 spectra |
|
0.924 0.904 | 0.936 |
0.000 0.000 | 0.000 |
0.000 0.000 | 0.010 |
0.000 0.000 | 0.000 |
0.000 0.000 | 0.000 |
0.000 0.000 | 0.000 |
0.076 0.060 | 0.087 |
0.000 0.000 | 0.000 |
| 3 spectra, TSFMFLR | 0.851 | 0.135 | 0.000 | 0.000 | 0.000 | 0.000 | 0.014 | 0.000 | ||
| 1 spectrum, DGYENAR | 0.835 | 0.005 | 0.000 | 0.000 | 0.078 | 0.083 | 0.000 | 0.000 | ||
| 3 spectra, ALSTESIER | 0.824 | 0.000 | 0.063 | 0.000 | 0.000 | 0.000 | 0.113 | 0.000 | ||
| 1 spectrum, TIYEFTDTVIR | 1.000 | 0.000 | 0.000 | 0.000 | 0.000 | 0.000 | 0.000 | 0.000 | ||
| 2 spectra, FSPSPLSMK | 0.344 | 0.272 | 0.000 | 0.000 | 0.021 | 0.002 | 0.361 | 0.000 | ||
| 2 spectra, QFLDFGSVNACEK | 0.716 | 0.000 | 0.000 | 0.110 | 0.130 | 0.044 | 0.000 | 0.000 | ||
| 2 spectra, LANIMK | 0.927 | 0.000 | 0.000 | 0.000 | 0.000 | 0.000 | 0.000 | 0.073 | ||
| 1 spectrum, LYAQYFQGDLK | 0.784 | 0.000 | 0.000 | 0.000 | 0.000 | 0.000 | 0.125 | 0.092 | ||
| 1 spectrum, ATMEHHADK | 0.893 | 0.000 | 0.000 | 0.000 | 0.000 | 0.000 | 0.000 | 0.107 | ||
| 5 spectra, MLLNQHSLLFGGK | 0.956 | 0.000 | 0.002 | 0.042 | 0.000 | 0.000 | 0.000 | 0.000 | ||
| 1 spectrum, AVPLAGFGYGLPISR | 0.906 | 0.000 | 0.000 | 0.000 | 0.000 | 0.000 | 0.000 | 0.094 | ||
| 1 spectrum, SAEDAK | 0.383 | 0.000 | 0.197 | 0.000 | 0.000 | 0.000 | 0.420 | 0.000 | ||
| 1 spectrum, ESFGVDPVTSQNVQYFLDR | 0.917 | 0.000 | 0.000 | 0.000 | 0.000 | 0.000 | 0.000 | 0.083 |
| Plot | Mito | Lyso or Perox | ER | Golgi | PM | Cytosol | Nucleus | ||||||
| Expt B |
4 peptides |
7 spectra |
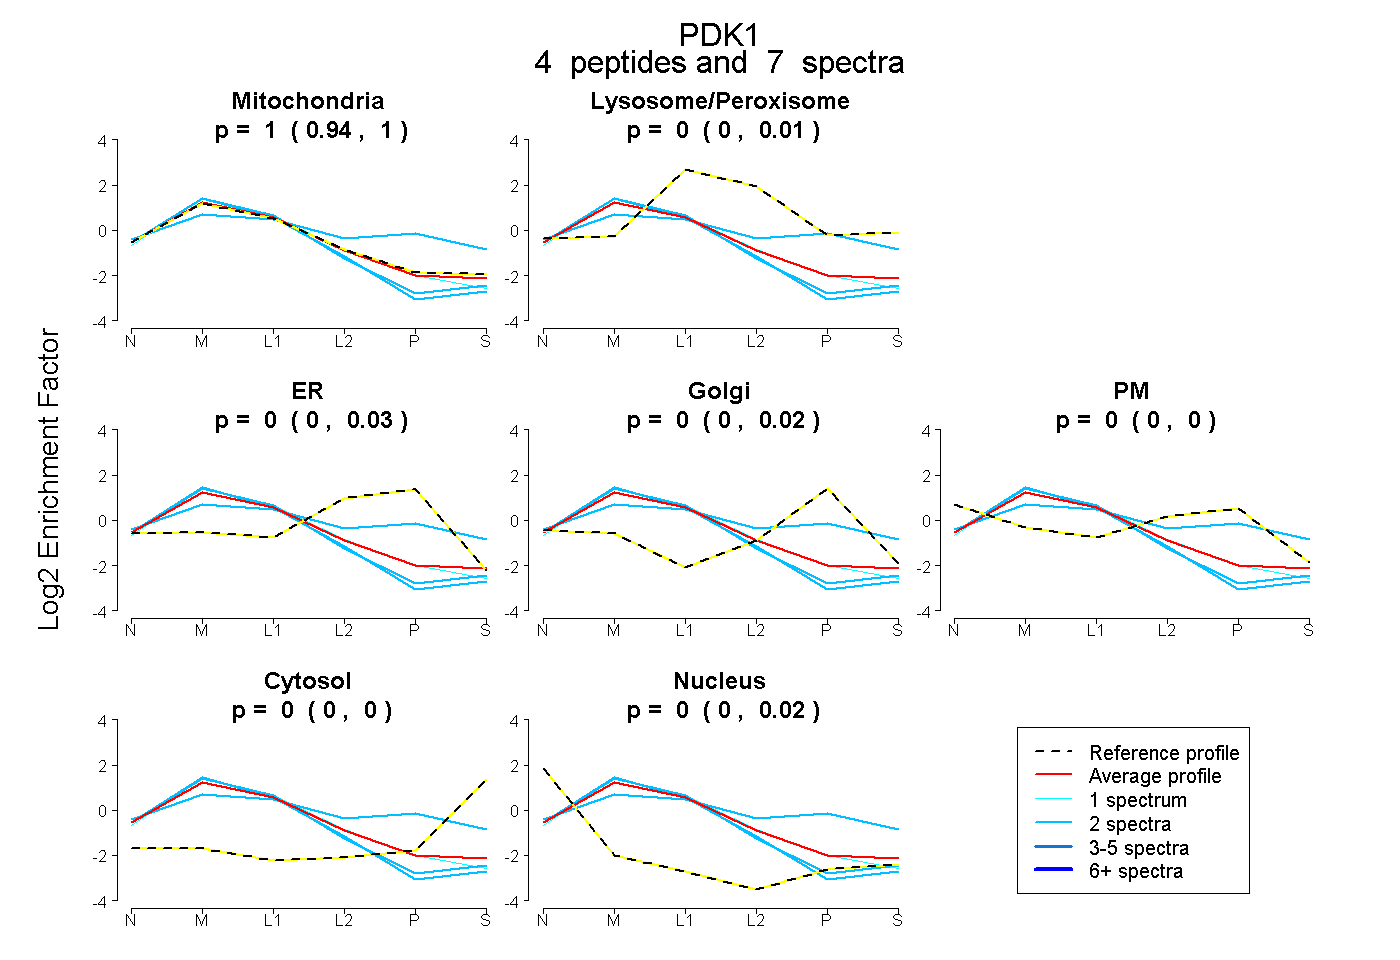 |
0.997 0.941 | 1.000 |
0.000 0.000 | 0.005 |
0.000 0.000 | 0.031 |
0.000 0.000 | 0.018 |
0.000 0.000 | 0.000 |
0.000 0.000 | 0.004 |
0.003 0.000 | 0.022 |
|||
| Plot | Lyso | Other | |||||||||||
| Expt C |
14 peptides |
107 spectra |
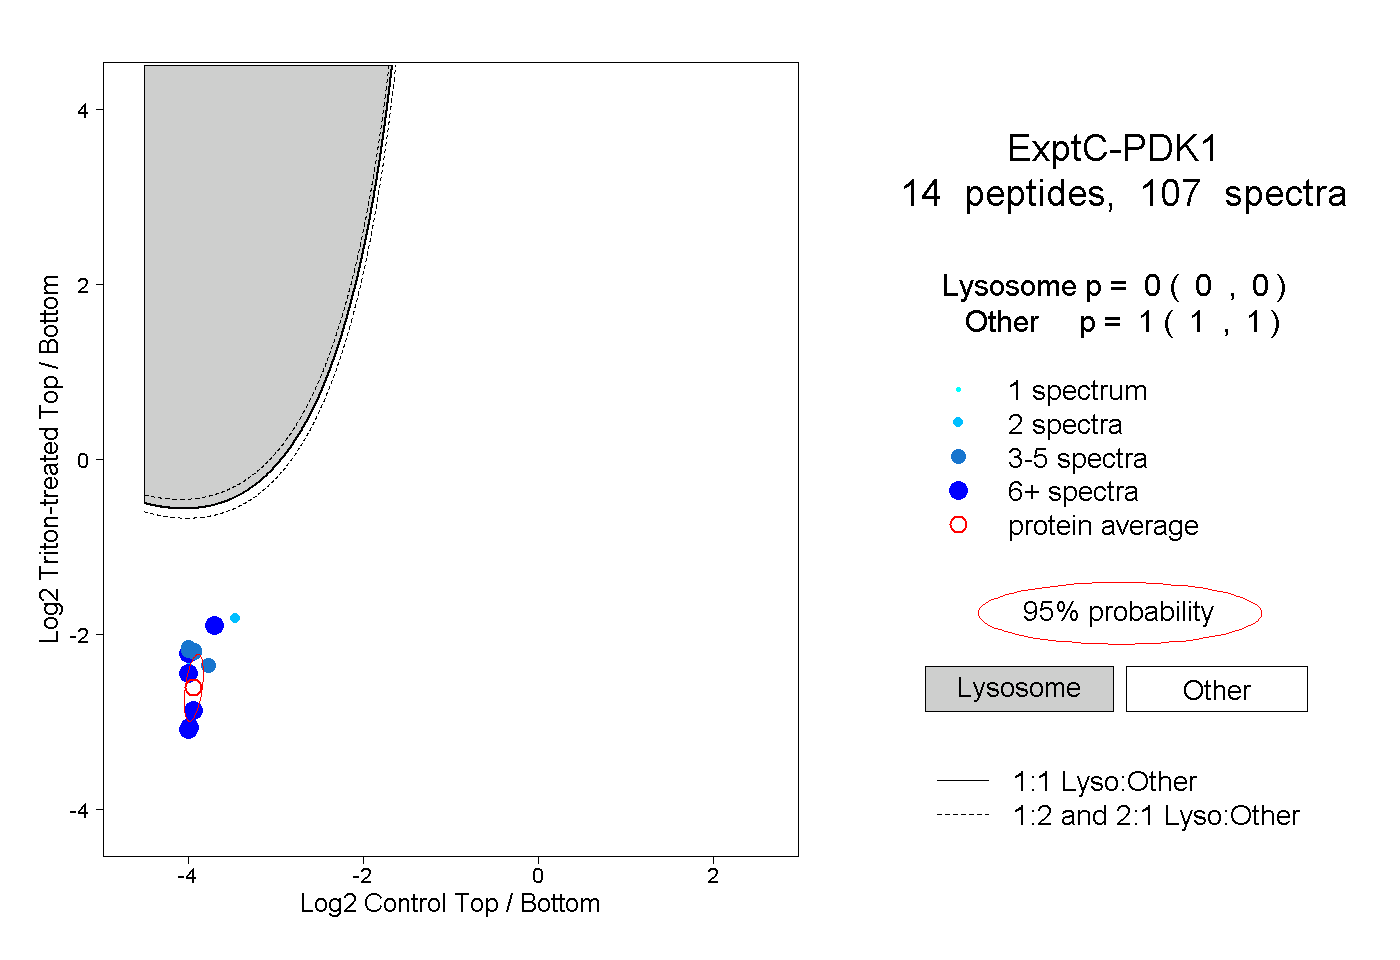 |
0.000 0.000 | 0.000 |
1.000 1.000 | 1.000 |
||||||||
| Plot | Lyso | Other | |||||||||||
| Expt D |
3 peptides |
5 spectra |
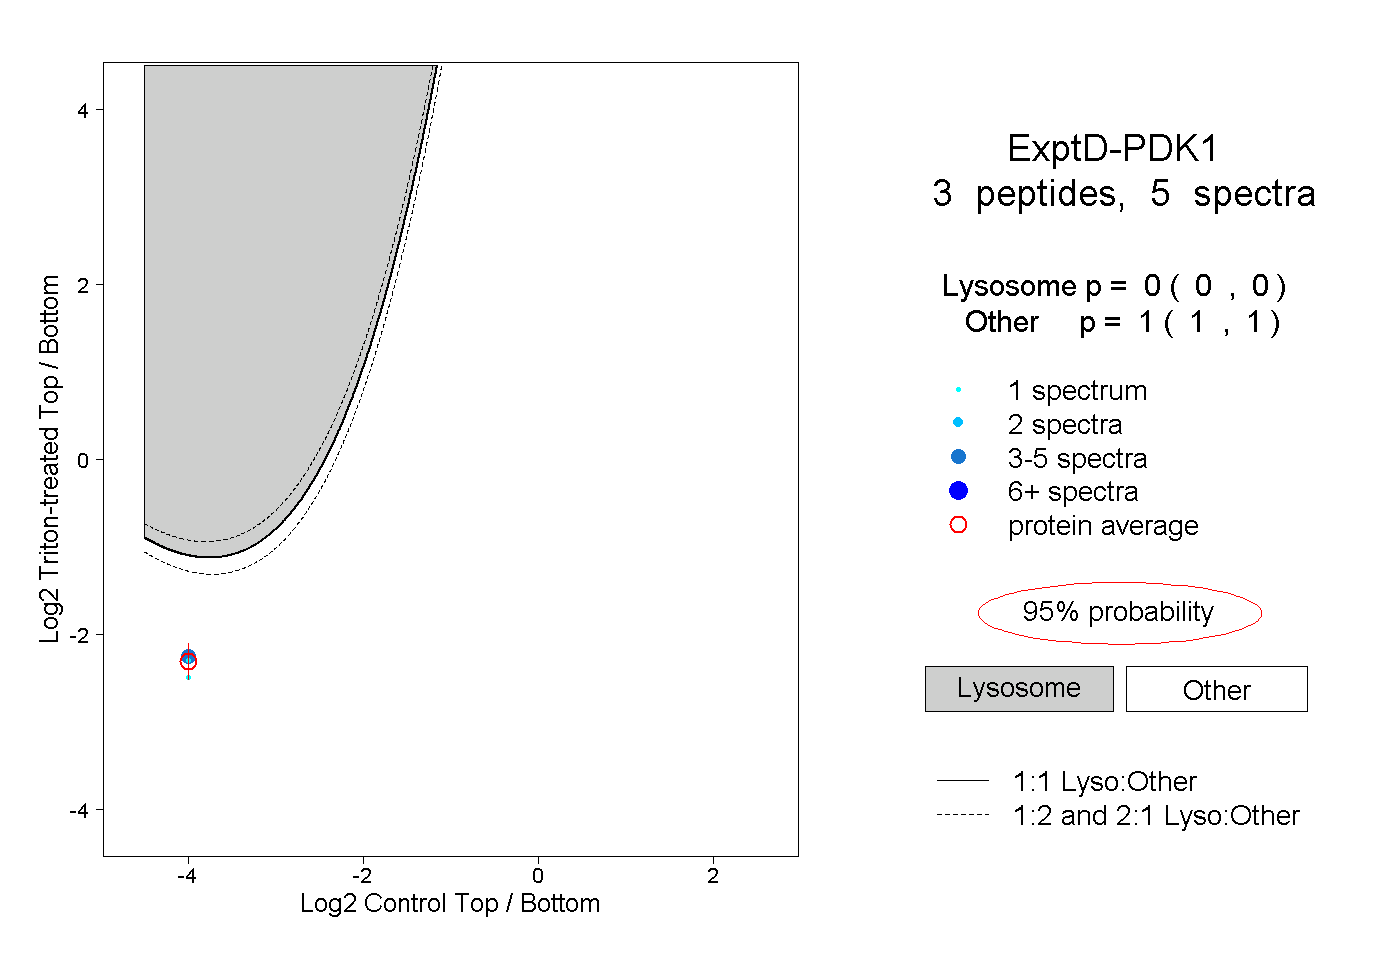 |
0.000 0.000 | 0.000 |
1.000 1.000 | 1.000 |