 6
6peptides
spectra
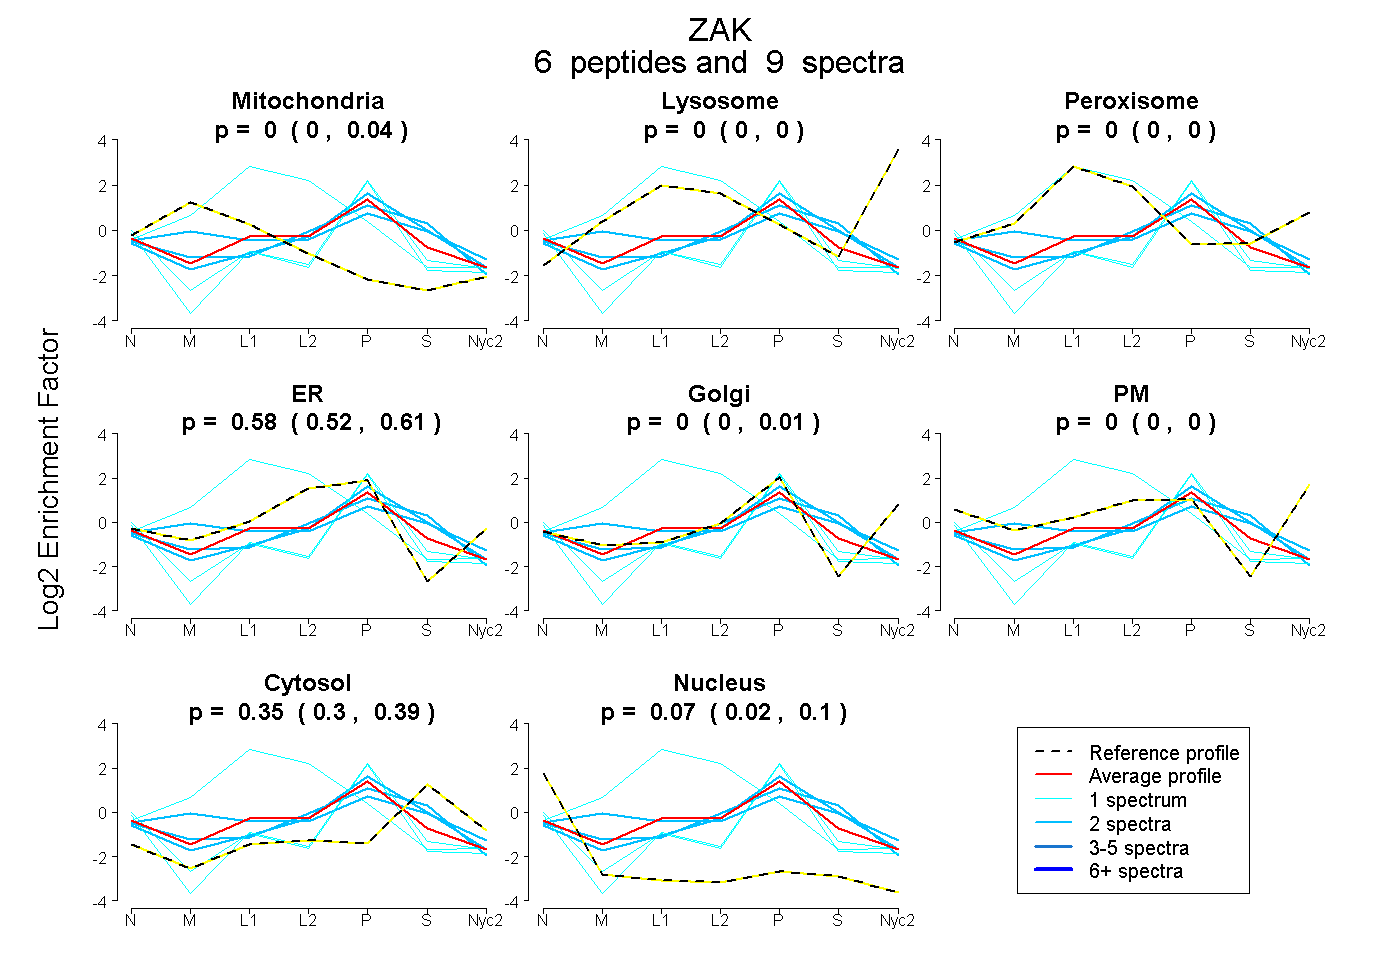
0.000 | 0.043
0.000 | 0.000
0.000 | 0.000
0.519 | 0.614
0.000 | 0.006
0.000 | 0.000
0.302 | 0.391
0.024 | 0.098
2peptides
spectra
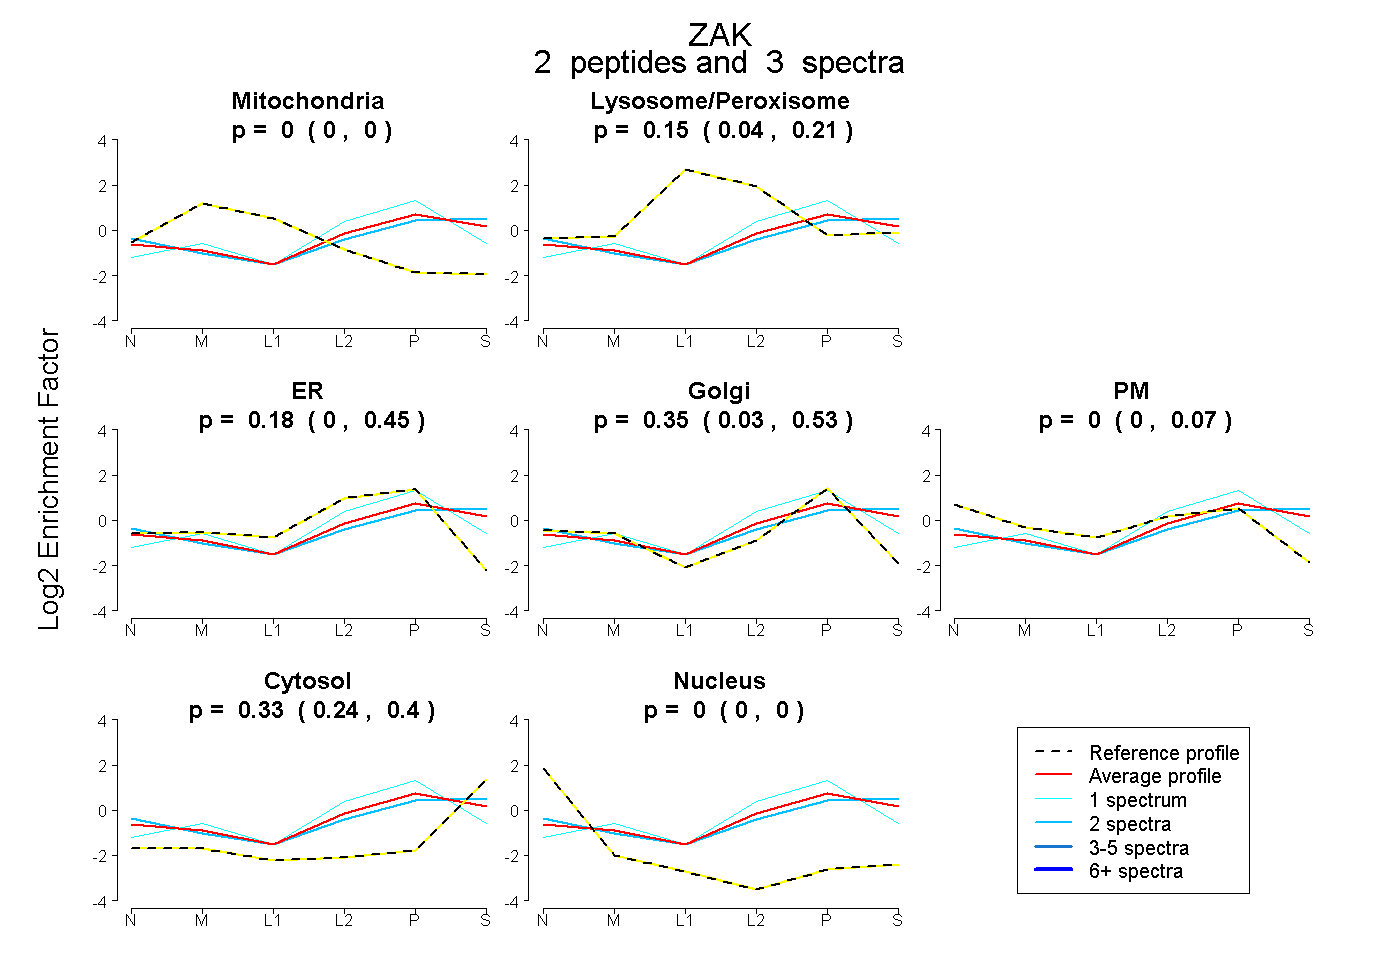
0.000 | 0.000
0.039 | 0.207
0.000 | 0.446
0.033 | 0.531
0.000 | 0.070
0.243 | 0.404
0.000 | 0.000
5peptides
spectra
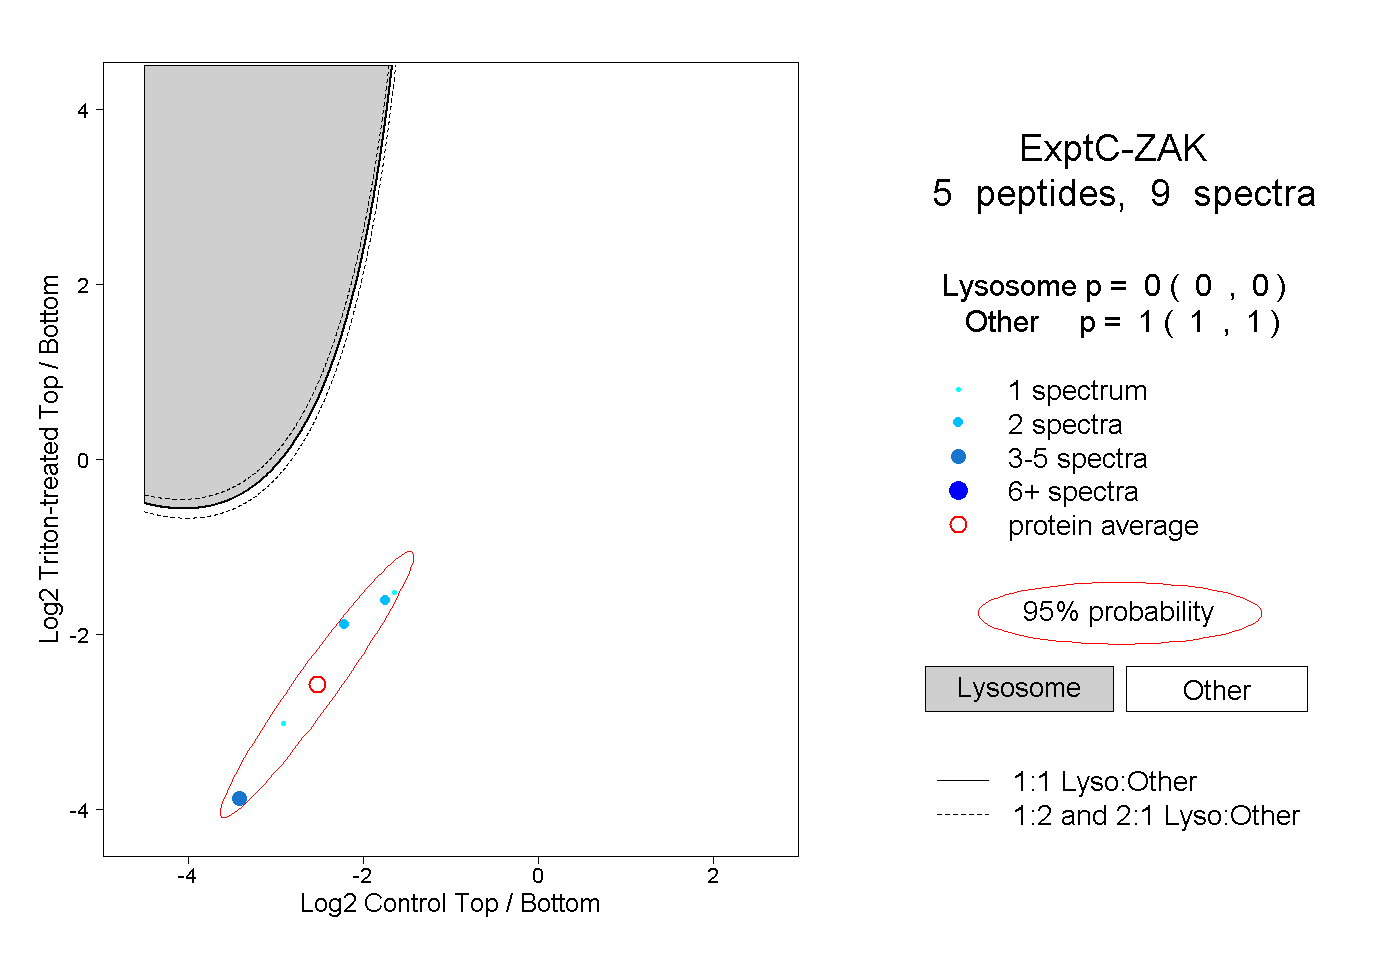
0.000 | 0.000
1.000 | 1.000
1peptide
spectra
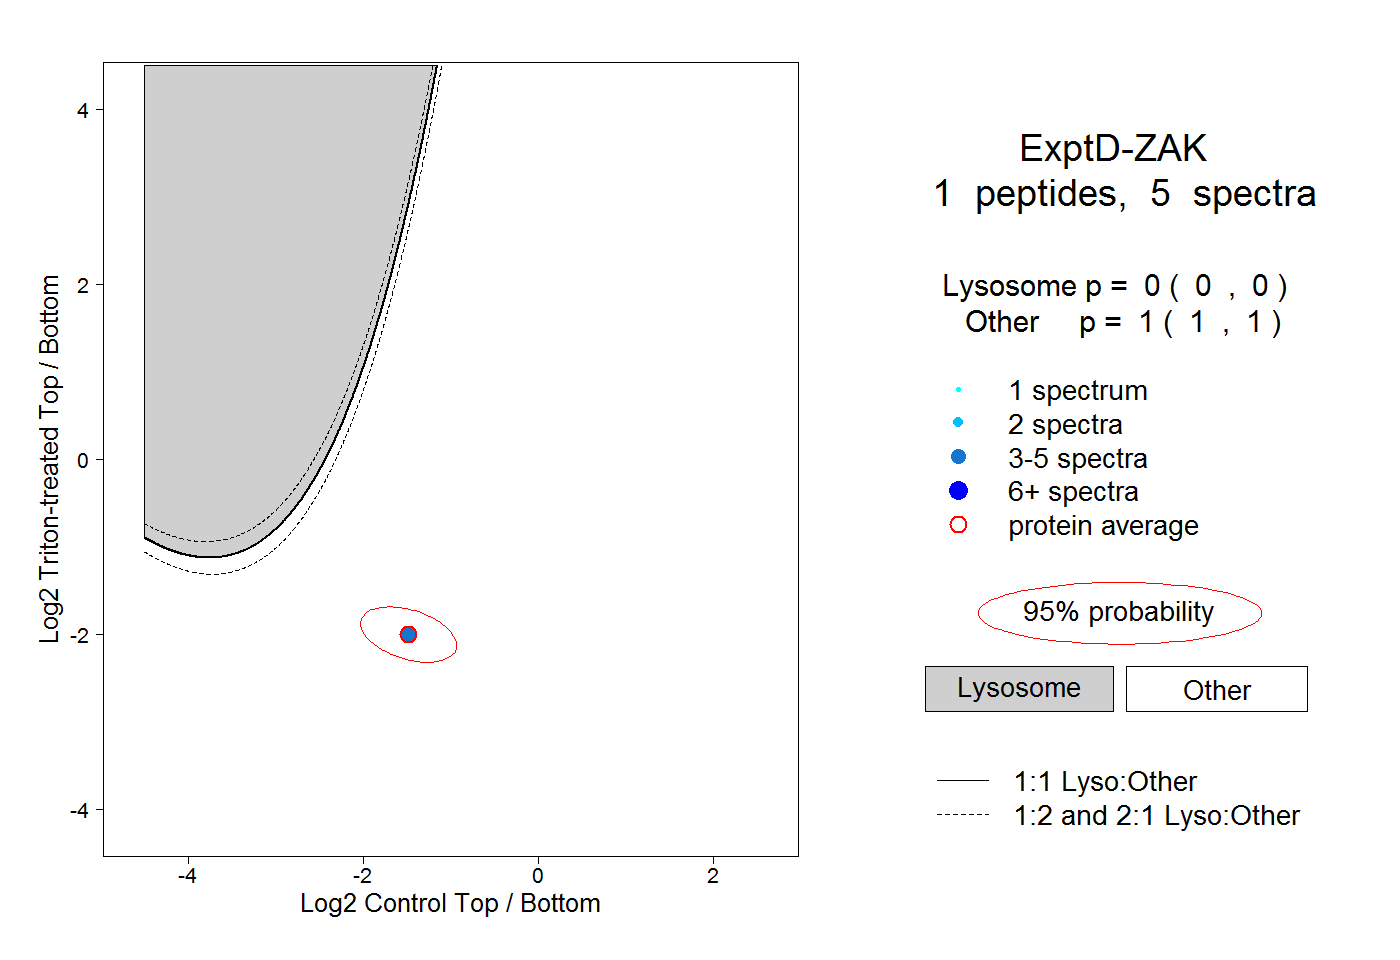
0.000 | 0.000
1.000 | 1.000