 6
6peptides
spectra
0.000 | 0.043
0.000 | 0.000
0.000 | 0.000
0.519 | 0.614
0.000 | 0.006
0.000 | 0.000
0.302 | 0.391
0.024 | 0.098
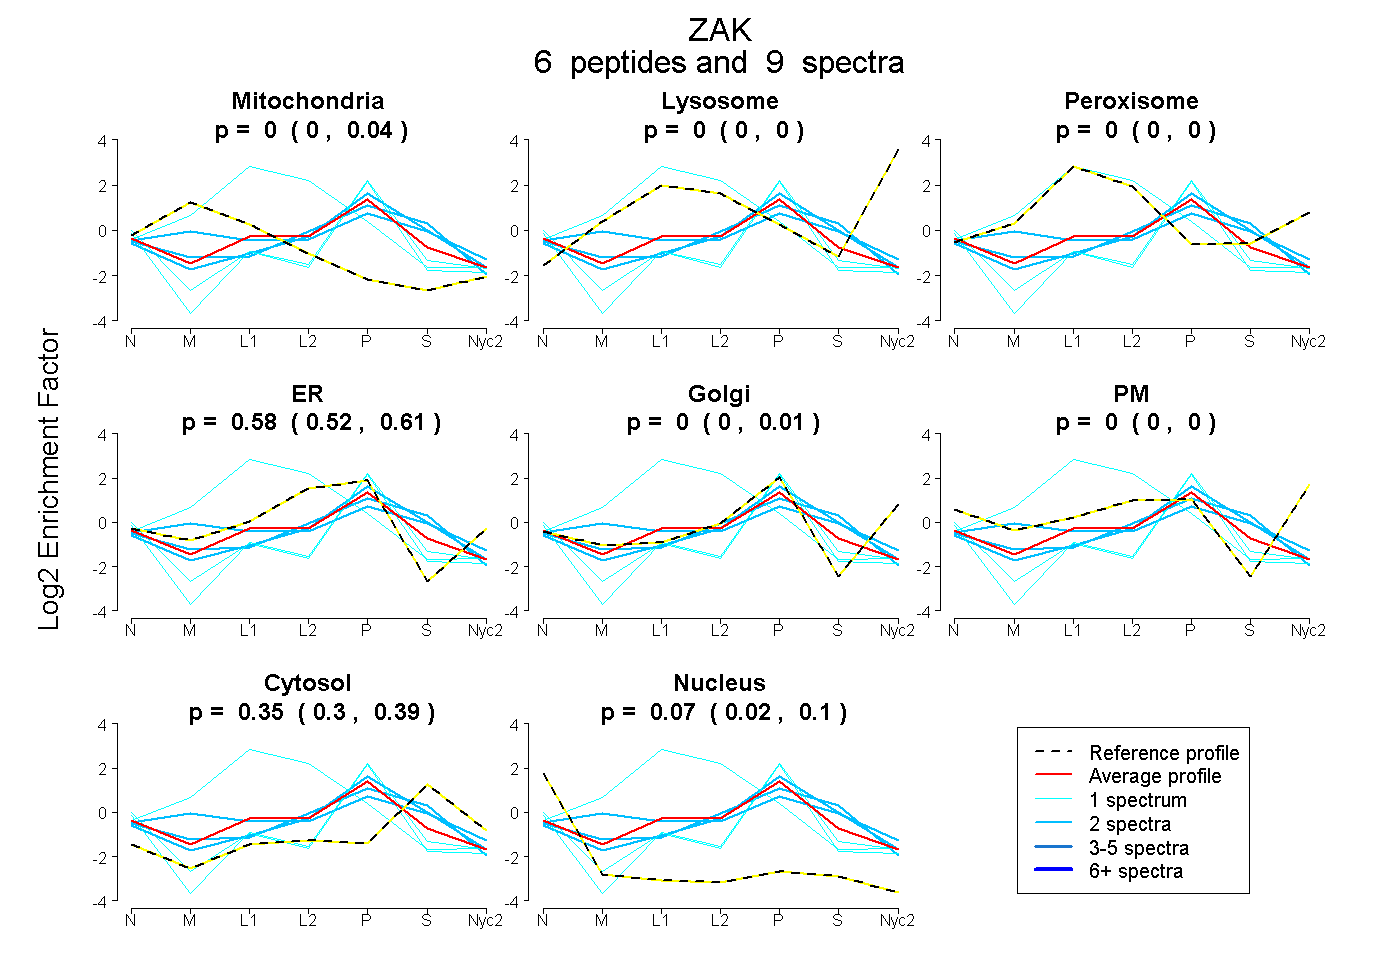
| Plot | Mito | Lyso | Perox | ER | Golgi | PM | Cytosol | Nucleus | |||||
| Expt A |
6 peptides |
9 spectra |
|
0.000 0.000 | 0.043 |
0.000 0.000 | 0.000 |
0.000 0.000 | 0.000 |
0.578 0.519 | 0.614 |
0.000 0.000 | 0.006 |
0.000 0.000 | 0.000 |
0.353 0.302 | 0.391 |
0.070 0.024 | 0.098 |
| 1 spectrum, TQTPVK | 0.142 | 0.000 | 0.598 | 0.260 | 0.000 | 0.000 | 0.000 | 0.000 | ||
| 1 spectrum, DSGFSSLNDSSSER | 0.000 | 0.000 | 0.000 | 0.091 | 0.542 | 0.000 | 0.098 | 0.270 | ||
| 1 spectrum, YQQITPSINPSR | 0.000 | 0.000 | 0.000 | 0.028 | 0.535 | 0.000 | 0.227 | 0.210 | ||
| 2 spectra, NVVIAADGVLK | 0.185 | 0.000 | 0.039 | 0.339 | 0.051 | 0.000 | 0.386 | 0.000 | ||
| 2 spectra, CEIEATLER | 0.000 | 0.000 | 0.000 | 0.448 | 0.000 | 0.000 | 0.527 | 0.025 | ||
| 2 spectra, GHIIHFK | 0.000 | 0.000 | 0.000 | 0.484 | 0.011 | 0.000 | 0.489 | 0.016 |
| Plot | Mito | Lyso or Perox | ER | Golgi | PM | Cytosol | Nucleus | ||||||
| Expt B |
2 peptides |
3 spectra |
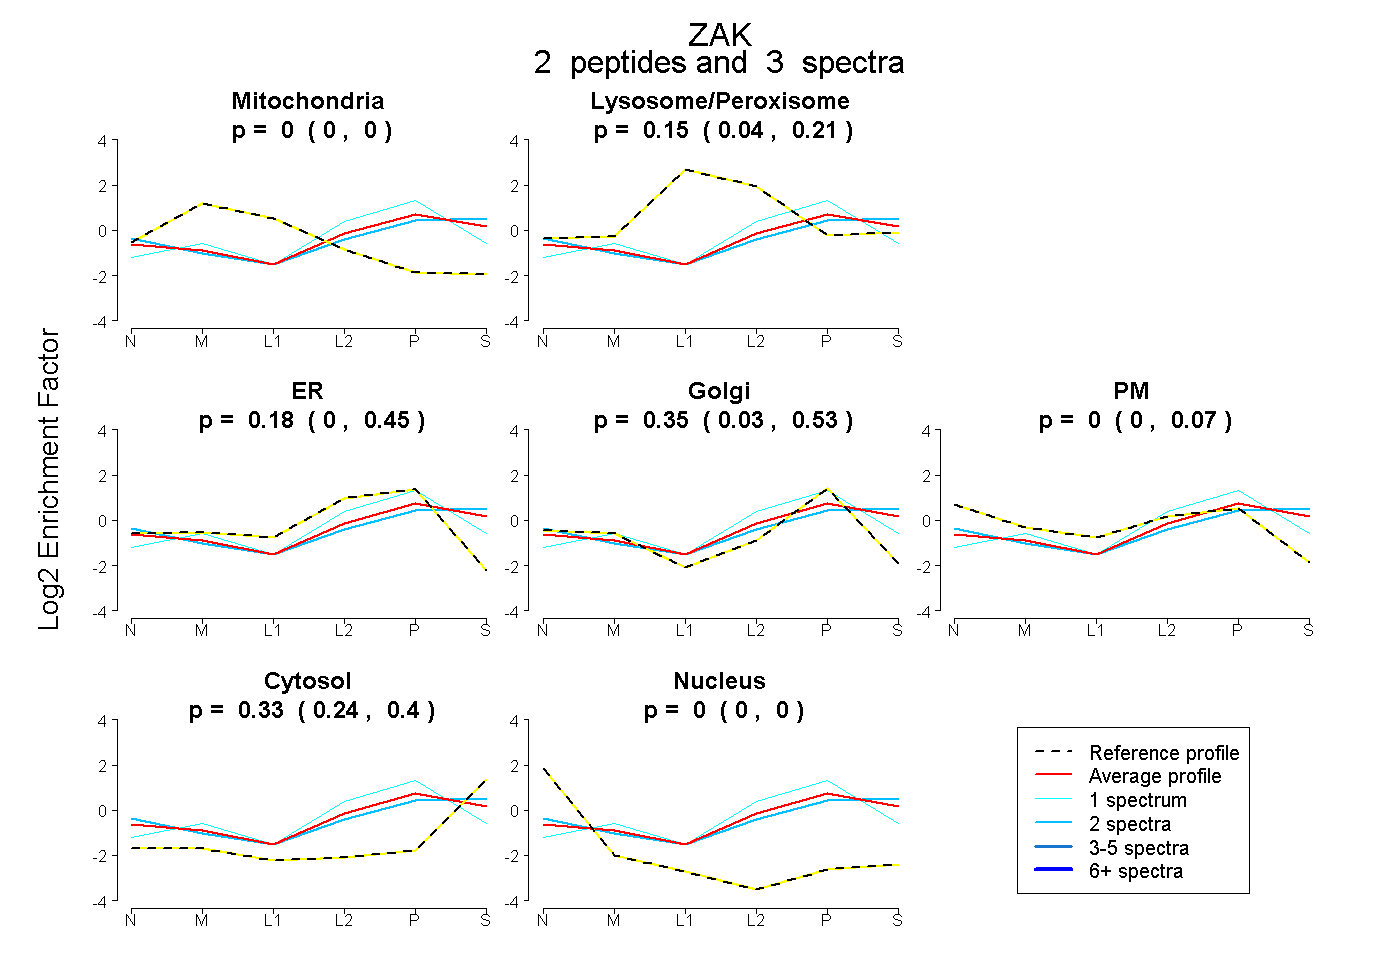 |
0.000 0.000 | 0.000 |
0.147 0.039 | 0.207 |
0.181 0.000 | 0.446 |
0.346 0.033 | 0.531 |
0.000 0.000 | 0.070 |
0.325 0.243 | 0.404 |
0.000 0.000 | 0.000 |
|||
| Plot | Lyso | Other | |||||||||||
| Expt C |
5 peptides |
9 spectra |
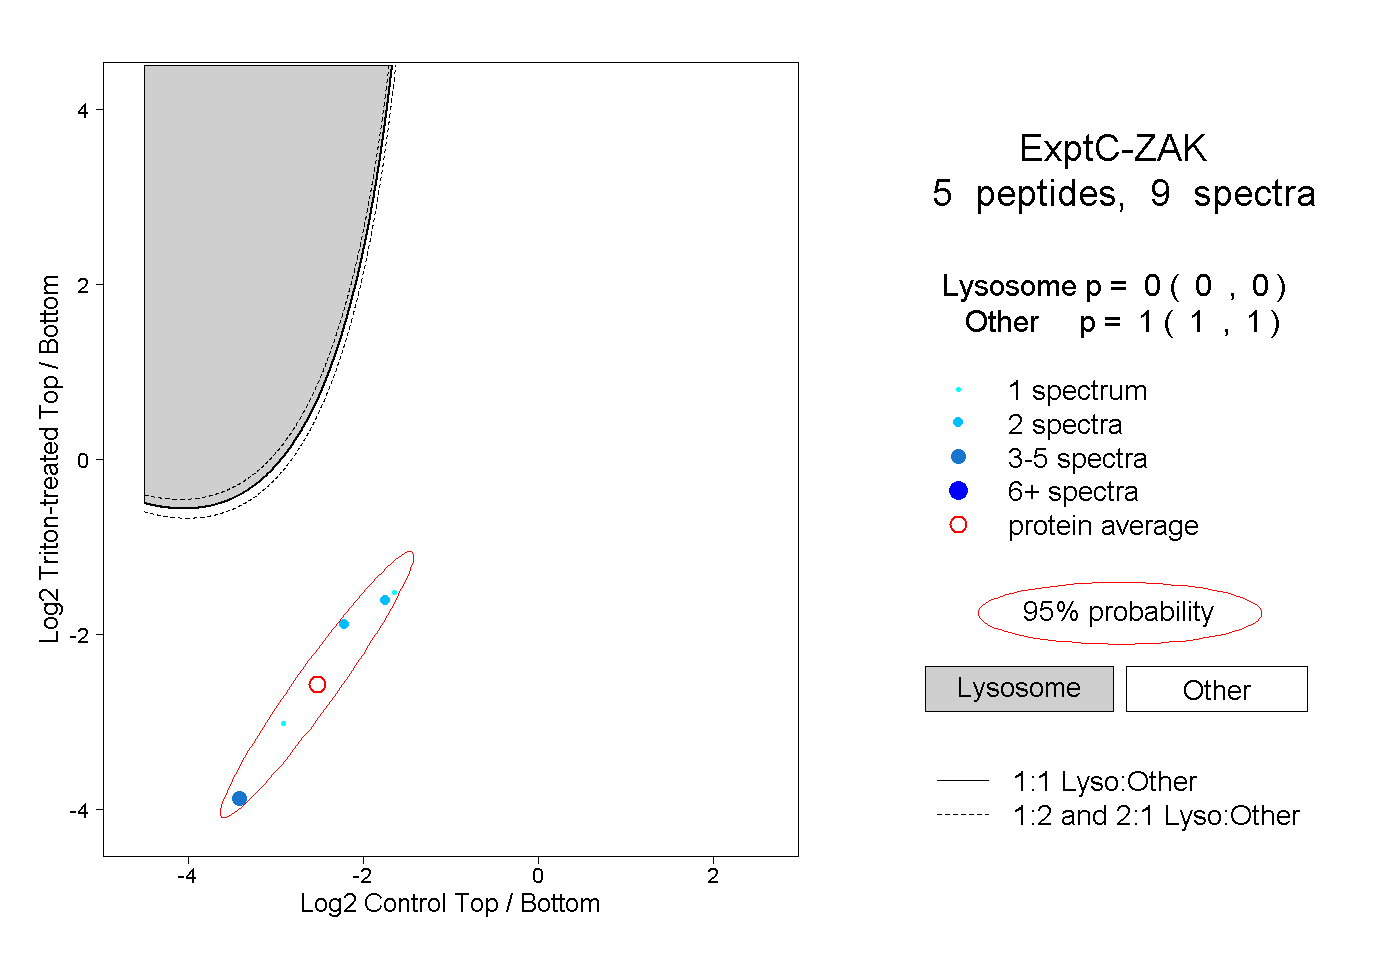 |
0.000 0.000 | 0.000 |
1.000 1.000 | 1.000 |
||||||||
| Plot | Lyso | Other | |||||||||||
| Expt D |
1 peptide |
5 spectra |
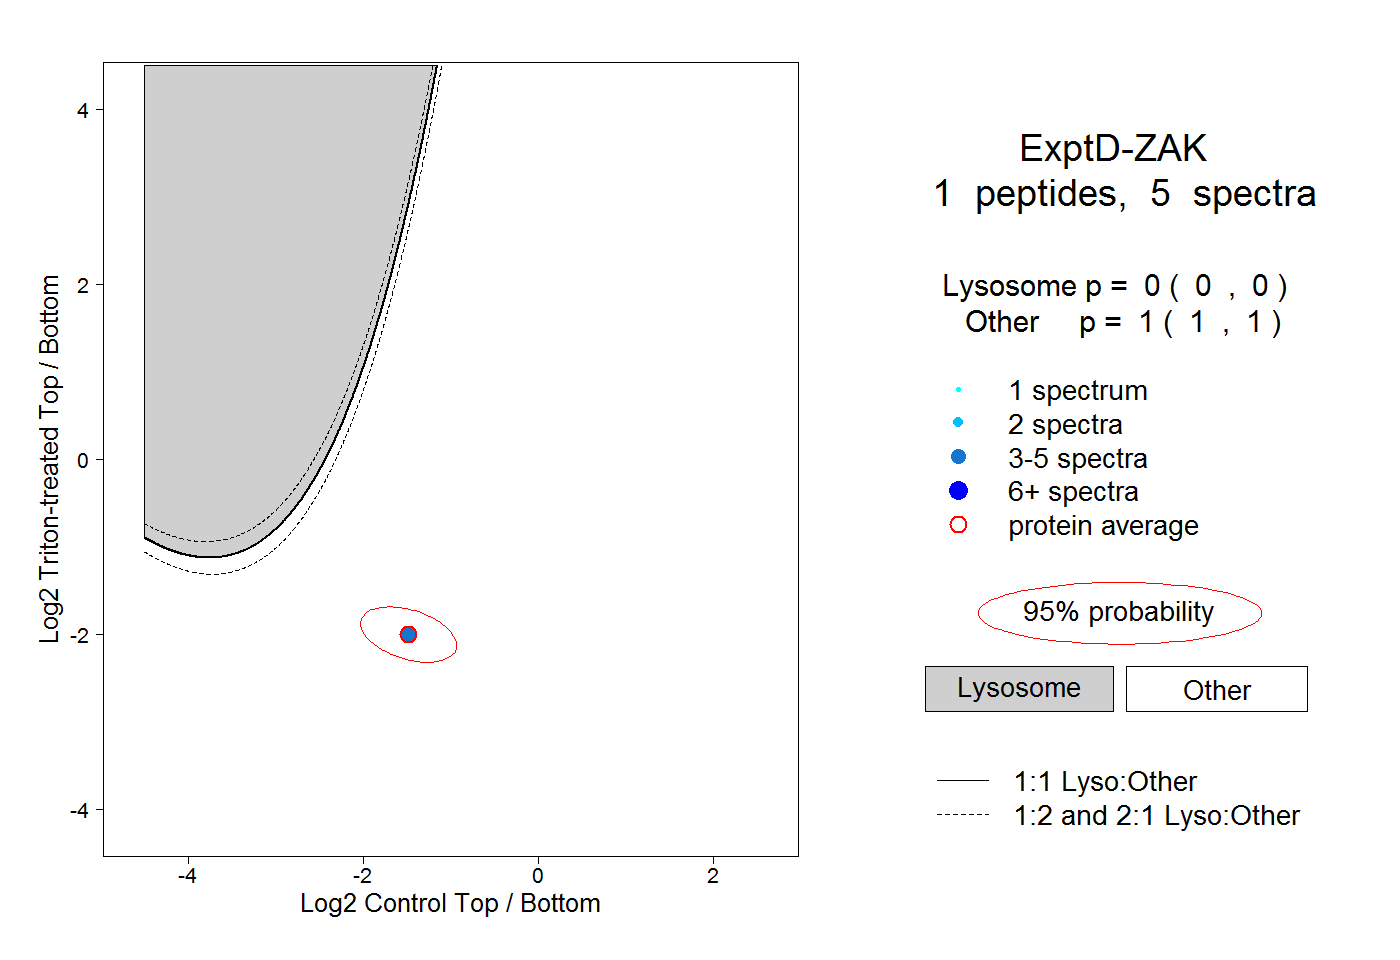 |
0.000 0.000 | 0.000 |
1.000 1.000 | 1.000 |