 14
14peptides
spectra
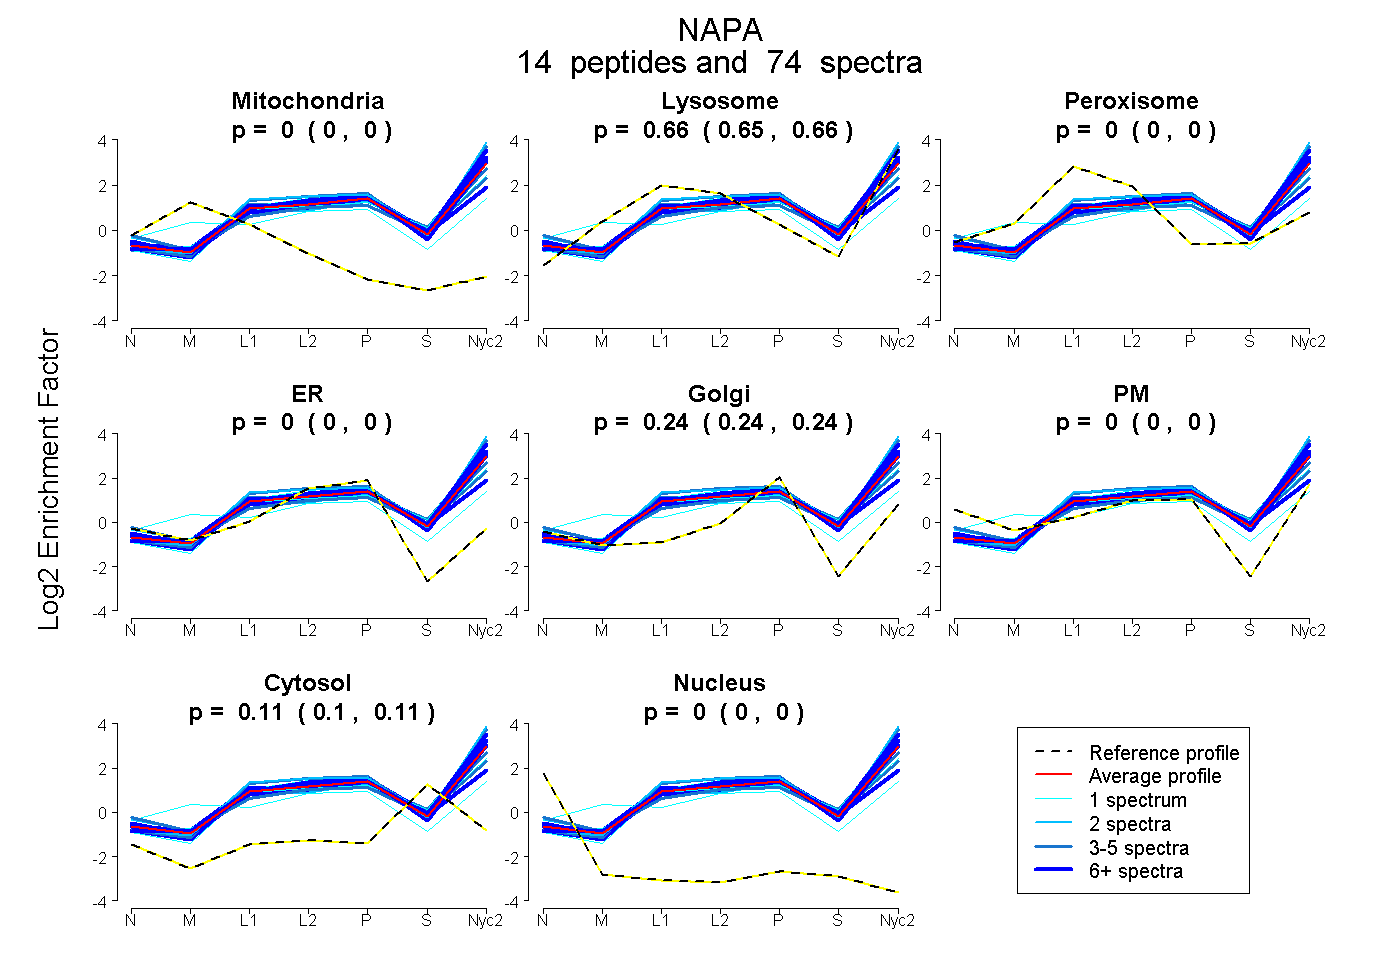
0.000 | 0.000
0.651 | 0.660
0.000 | 0.000
0.000 | 0.000
0.236 | 0.242
0.000 | 0.000
0.102 | 0.108
0.000 | 0.000
11peptides
spectra
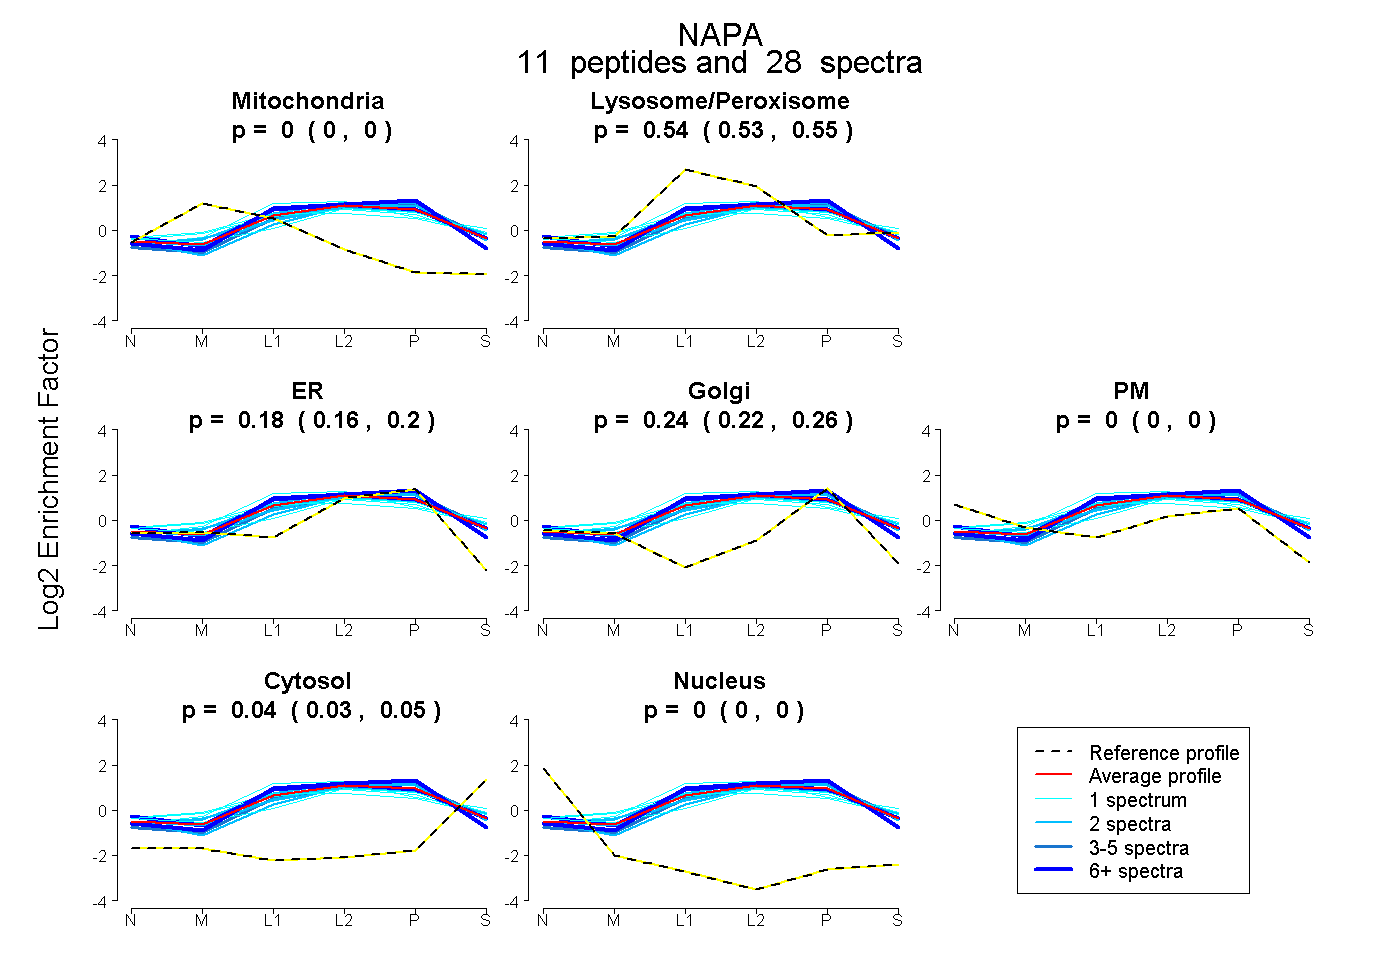
0.000 | 0.000
0.527 | 0.549
0.157 | 0.203
0.219 | 0.259
0.000 | 0.000
0.030 | 0.045
0.000 | 0.000
18peptides
spectra
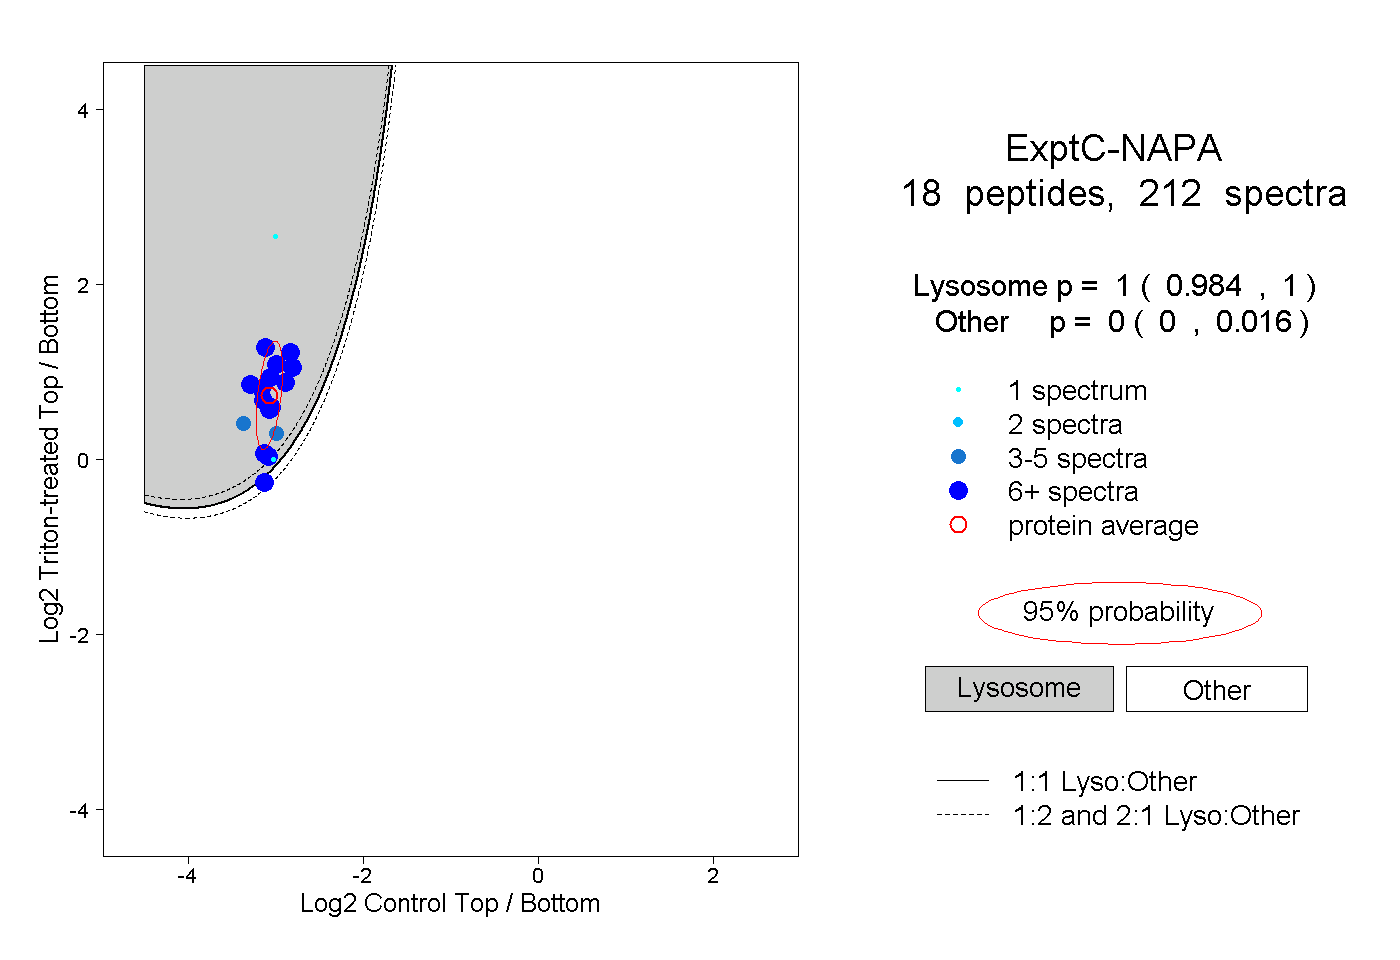
0.984 | 1.000
0.000 | 0.016
5peptides
spectra
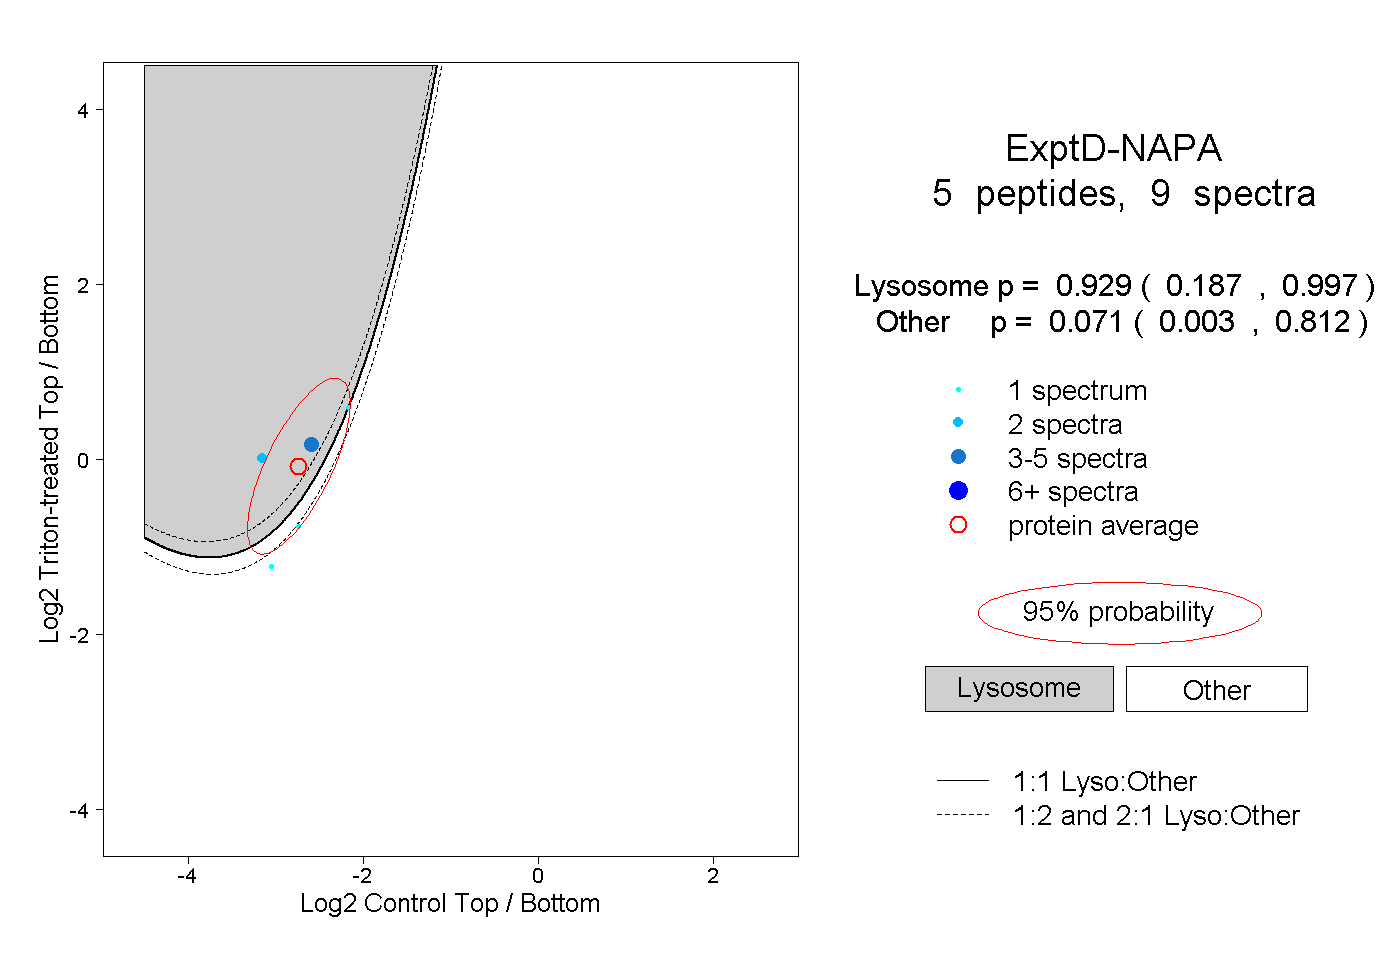
0.187 | 0.997
0.003 | 0.812