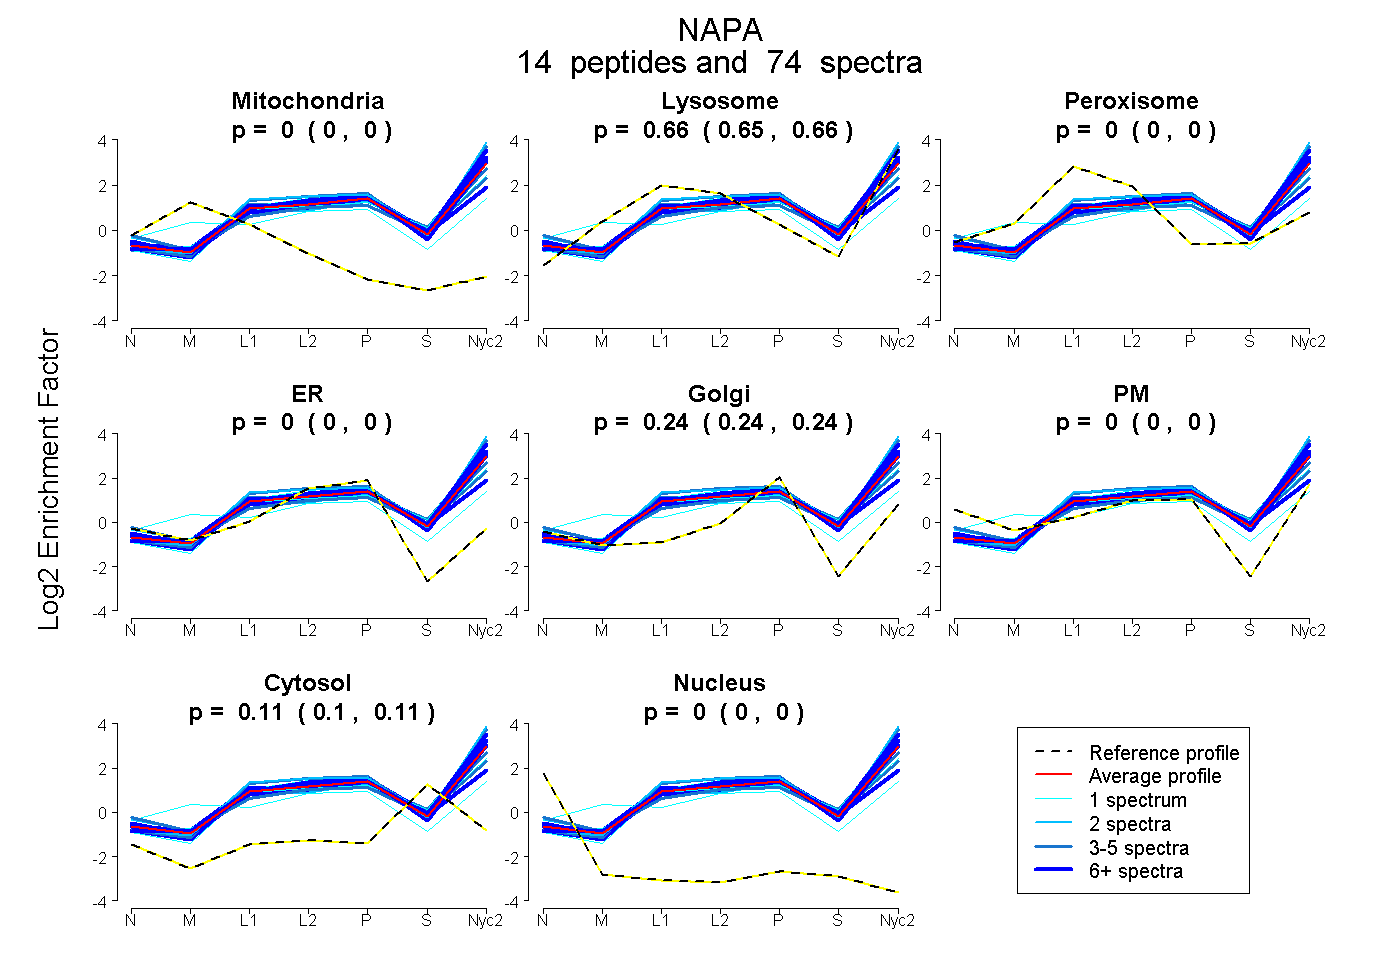
 14
14peptides
spectra
0.000 | 0.000
0.651 | 0.660
0.000 | 0.000
0.000 | 0.000
0.236 | 0.242
0.000 | 0.000
0.102 | 0.108
0.000 | 0.000
| Plot | Mito | Lyso | Perox | ER | Golgi | PM | Cytosol | Nucleus | |||||
| Expt A |
14 peptides |
74 spectra |
|
0.000 0.000 | 0.000 |
0.656 0.651 | 0.660 |
0.000 0.000 | 0.000 |
0.000 0.000 | 0.000 |
0.239 0.236 | 0.242 |
0.000 0.000 | 0.000 |
0.105 0.102 | 0.108 |
0.000 0.000 | 0.000 |
| 1 spectrum, HDAATCFVDAGNAFK | 0.000 | 0.592 | 0.000 | 0.113 | 0.147 | 0.000 | 0.148 | 0.000 | ||
| 8 spectra, IEEACEIYAR | 0.000 | 0.436 | 0.070 | 0.062 | 0.242 | 0.022 | 0.168 | 0.000 | ||
| 15 spectra, TIQGDEEDLR | 0.000 | 0.629 | 0.000 | 0.000 | 0.247 | 0.062 | 0.063 | 0.000 | ||
| 2 spectra, VAGYAAQLEQYQK | 0.000 | 0.809 | 0.000 | 0.000 | 0.173 | 0.000 | 0.018 | 0.000 | ||
| 4 spectra, ADPQEAINCLMR | 0.000 | 0.595 | 0.000 | 0.096 | 0.141 | 0.000 | 0.168 | 0.000 | ||
| 7 spectra, YEELFPAFSDSR | 0.000 | 0.740 | 0.000 | 0.000 | 0.181 | 0.000 | 0.079 | 0.000 | ||
| 1 spectrum, FTIAAK | 0.009 | 0.233 | 0.180 | 0.000 | 0.289 | 0.201 | 0.087 | 0.000 | ||
| 2 spectra, AIAHYEQSADYYK | 0.000 | 0.575 | 0.000 | 0.000 | 0.160 | 0.150 | 0.115 | 0.000 | ||
| 1 spectrum, LLEAHEEQNVDSYTESVK | 0.000 | 0.745 | 0.000 | 0.000 | 0.123 | 0.000 | 0.133 | 0.000 | ||
| 15 spectra, AIEIYTDMGR | 0.000 | 0.696 | 0.000 | 0.000 | 0.224 | 0.000 | 0.080 | 0.000 | ||
| 3 spectra, QAEAMALLAEAER | 0.000 | 0.493 | 0.000 | 0.000 | 0.040 | 0.292 | 0.175 | 0.000 | ||
| 3 spectra, NSQSFFSGLFGGSSK | 0.000 | 0.778 | 0.000 | 0.000 | 0.193 | 0.000 | 0.029 | 0.000 | ||
| 4 spectra, AANMFK | 0.000 | 0.688 | 0.000 | 0.000 | 0.160 | 0.000 | 0.152 | 0.000 | ||
| 8 spectra, EYDSISR | 0.000 | 0.713 | 0.000 | 0.000 | 0.199 | 0.000 | 0.088 | 0.000 |
| Plot | Mito | Lyso or Perox | ER | Golgi | PM | Cytosol | Nucleus | ||||||
| Expt B |
11 peptides |
28 spectra |
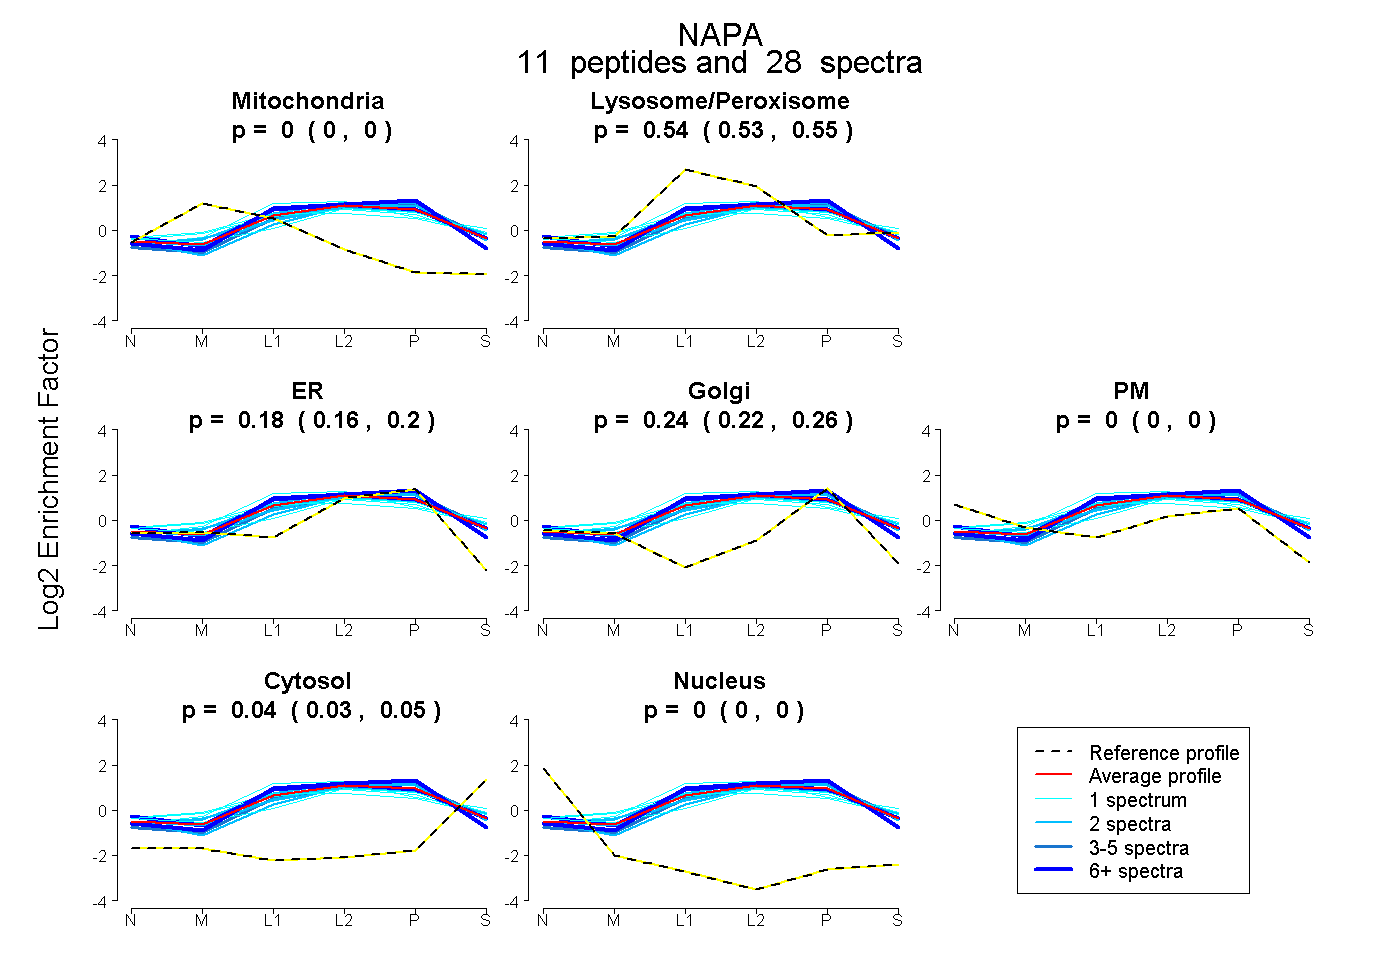 |
0.000 0.000 | 0.000 |
0.539 0.527 | 0.549 |
0.182 0.157 | 0.203 |
0.241 0.219 | 0.259 |
0.000 0.000 | 0.000 |
0.038 0.030 | 0.045 |
0.000 0.000 | 0.000 |
|||
| Plot | Lyso | Other | |||||||||||
| Expt C |
18 peptides |
212 spectra |
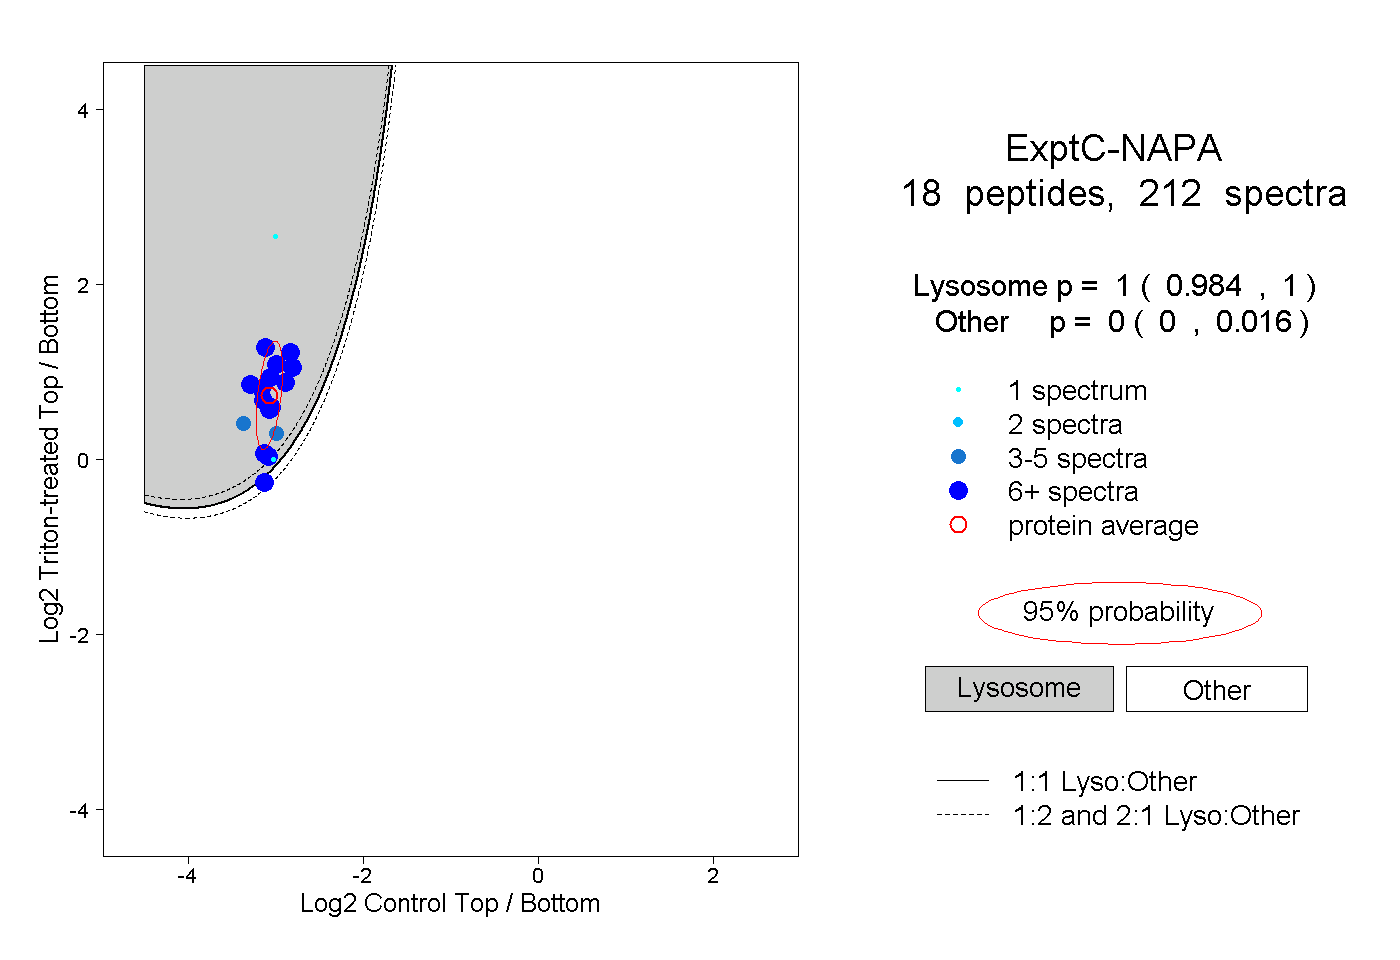 |
1.000 0.984 | 1.000 |
0.000 0.000 | 0.016 |
||||||||
| Plot | Lyso | Other | |||||||||||
| Expt D |
5 peptides |
9 spectra |
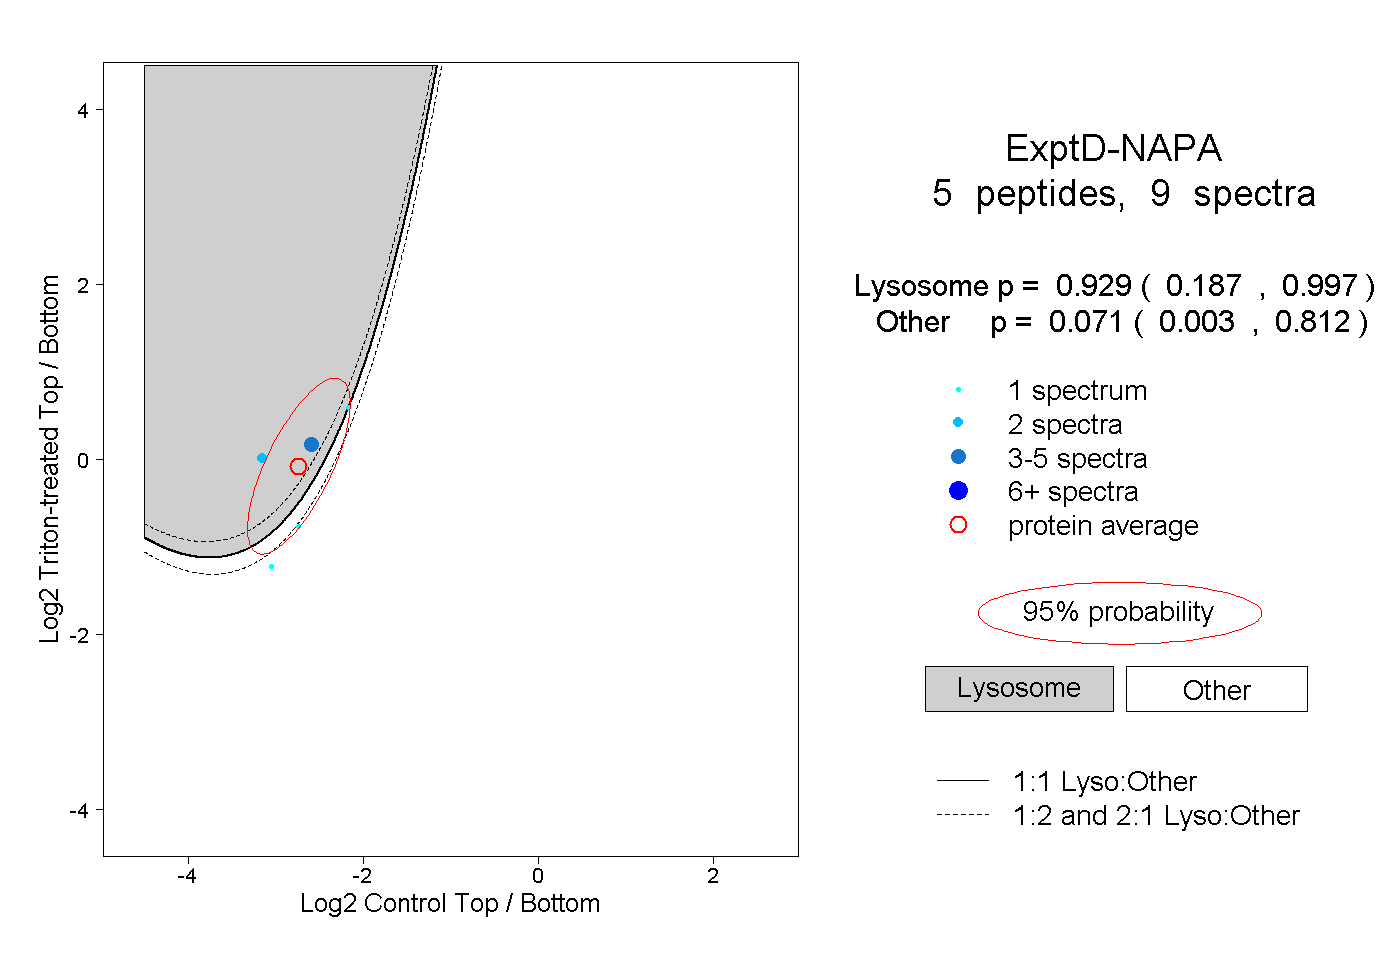 |
0.929 0.187 | 0.997 |
0.071 0.003 | 0.812 |