 7
7peptides
spectra
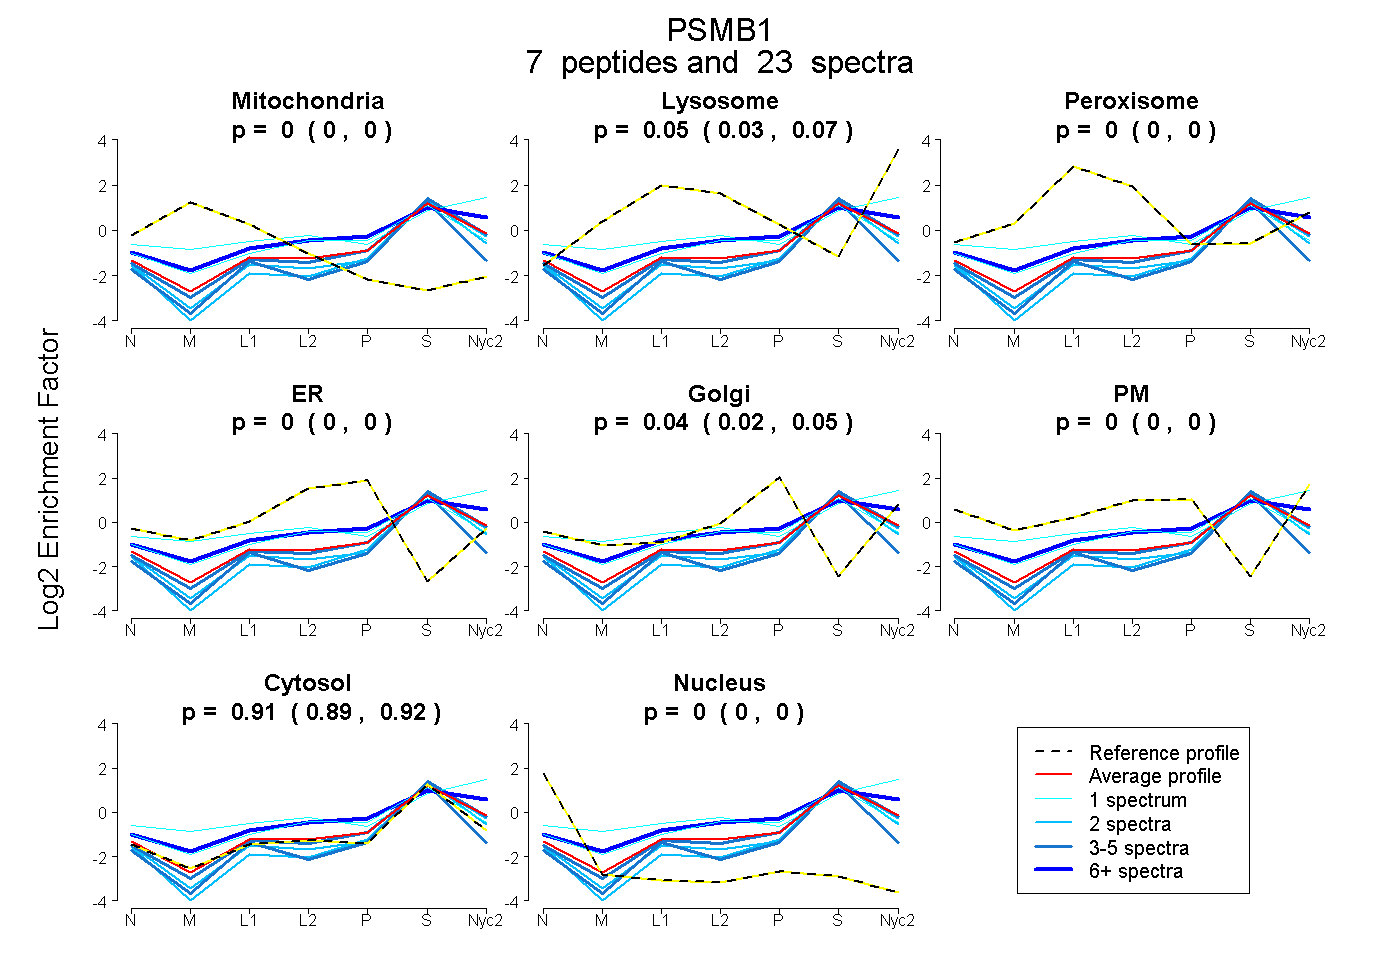
0.000 | 0.000
0.032 | 0.070
0.000 | 0.000
0.000 | 0.000
0.024 | 0.054
0.000 | 0.000
0.892 | 0.918
0.000 | 0.000
4peptides
spectra
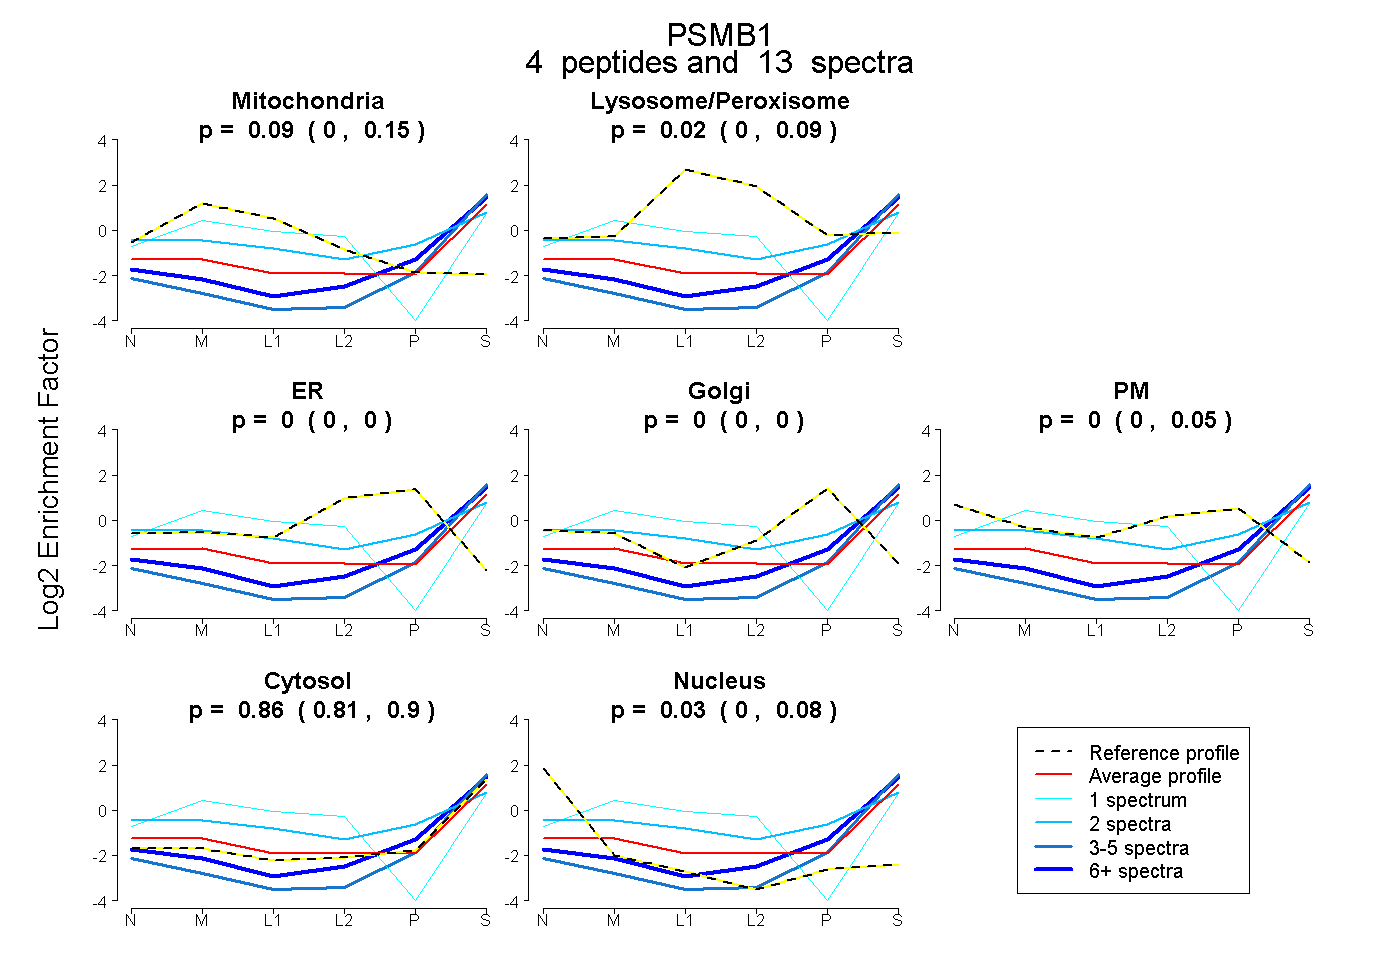
0.000 | 0.150
0.000 | 0.088
0.000 | 0.000
0.000 | 0.000
0.000 | 0.048
0.808 | 0.902
0.000 | 0.078
8peptides
spectra
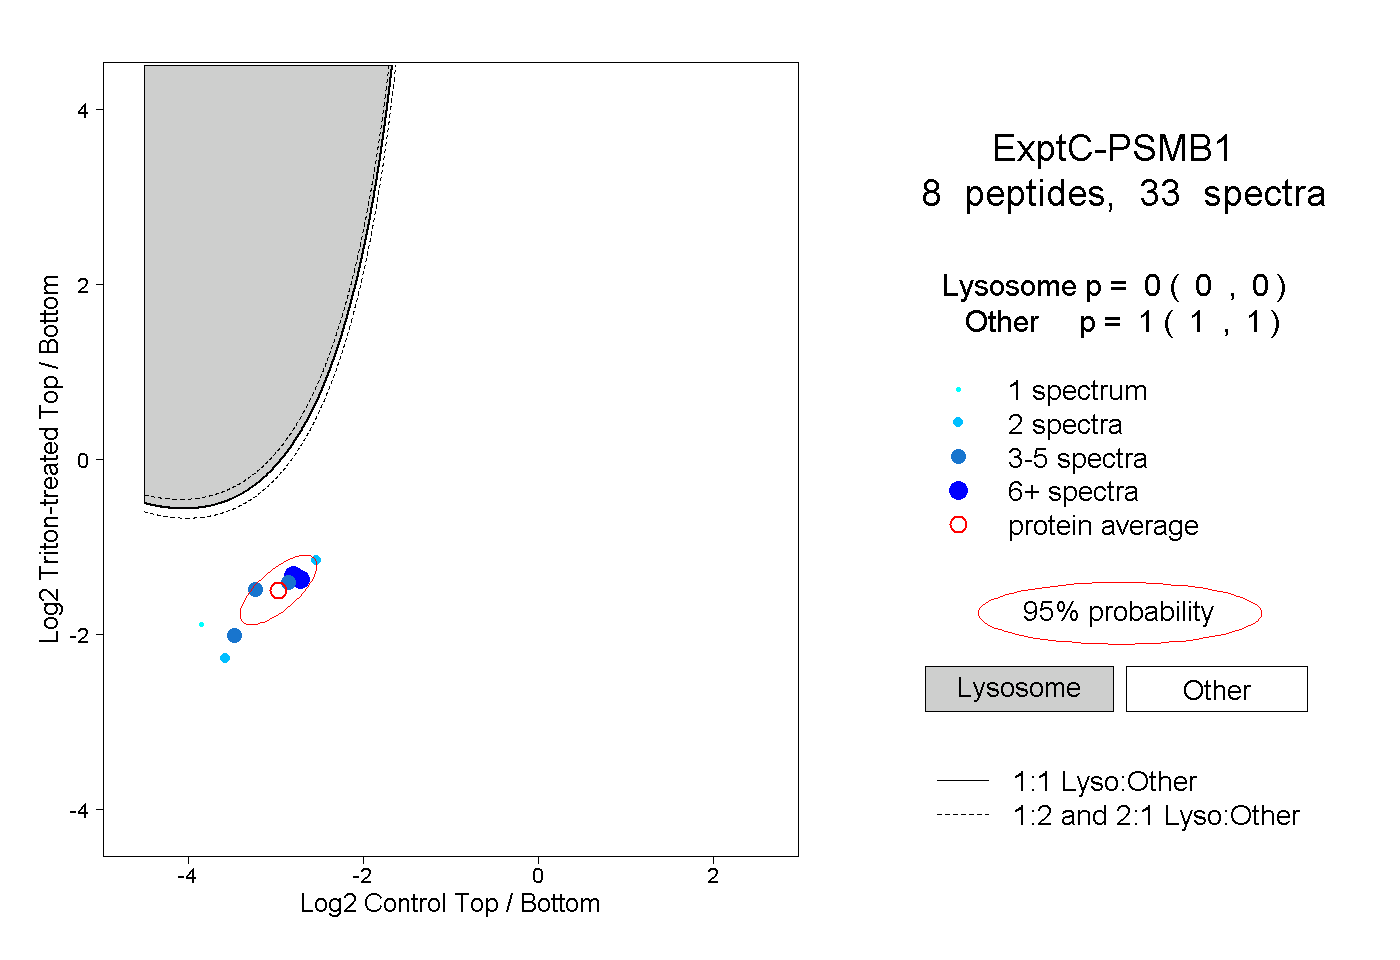
0.000 | 0.000
1.000 | 1.000
2peptides
spectra
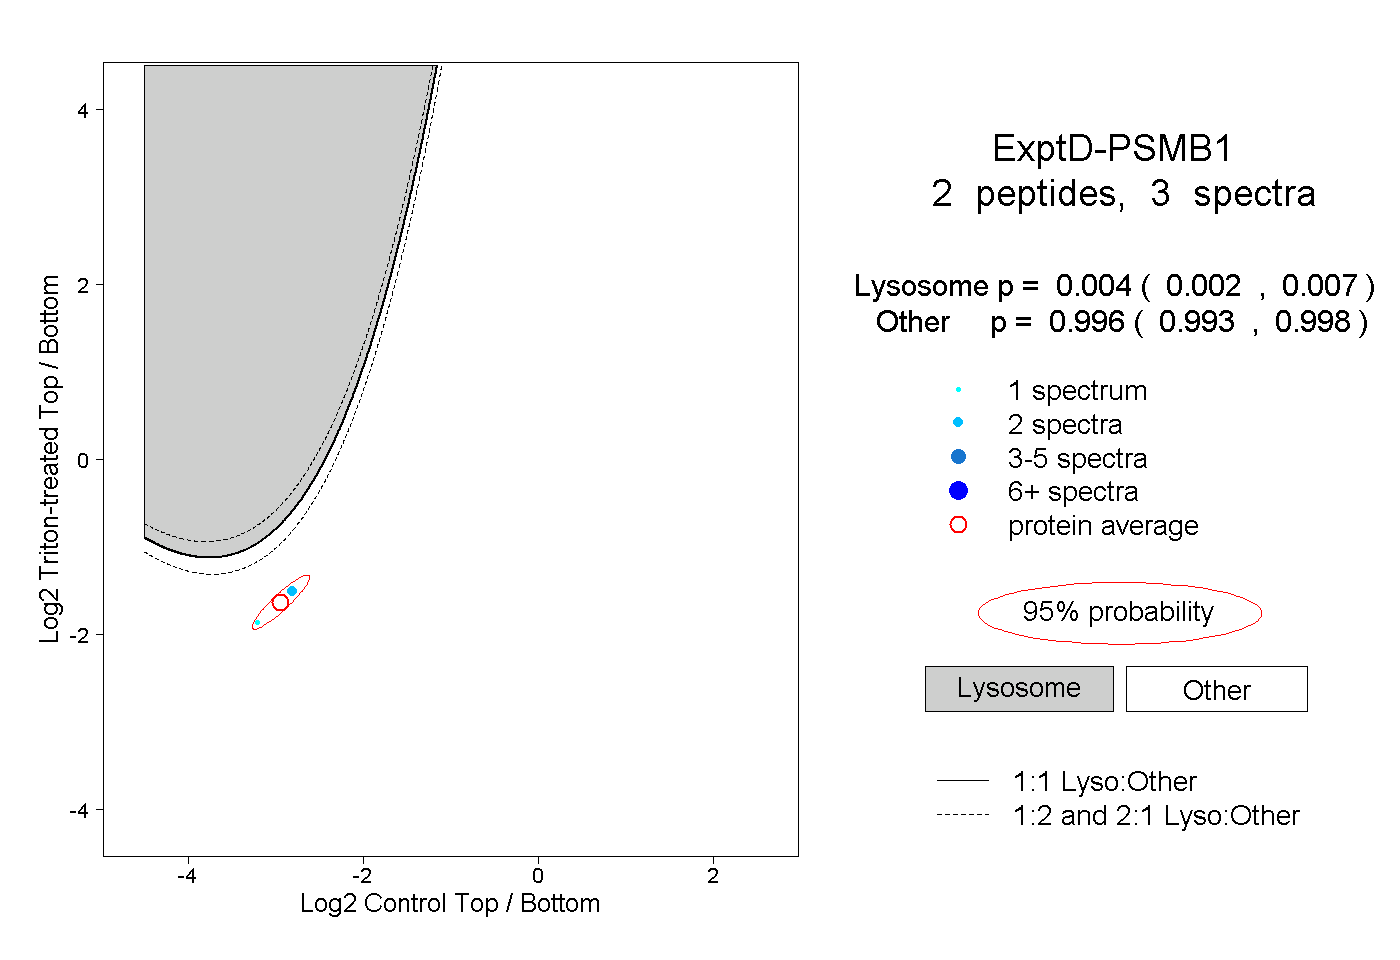
0.002 | 0.007
0.993 | 0.998