 7
7peptides
spectra
0.000 | 0.000
0.032 | 0.070
0.000 | 0.000
0.000 | 0.000
0.024 | 0.054
0.000 | 0.000
0.892 | 0.918
0.000 | 0.000
| Plot | Mito | Lyso | Perox | ER | Golgi | PM | Cytosol | Nucleus | |||||
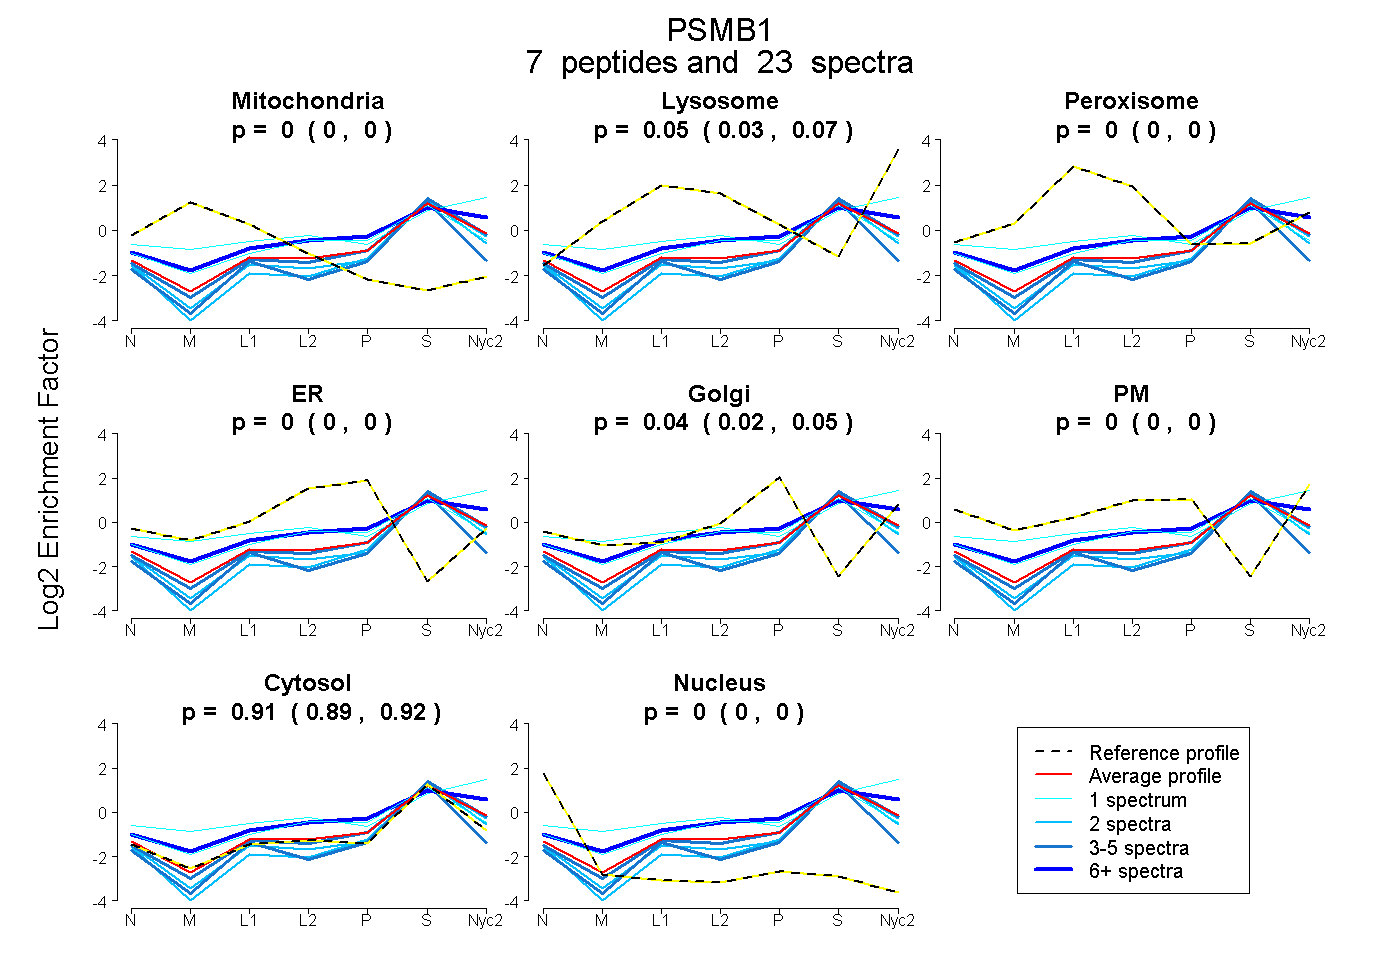
| Expt A |
7 peptides |
23 spectra |
|
0.000 0.000 | 0.000 |
0.053 0.032 | 0.070 |
0.000 0.000 | 0.000 |
0.000 0.000 | 0.000 |
0.040 0.024 | 0.054 |
0.000 0.000 | 0.000 |
0.907 0.892 | 0.918 |
0.000 0.000 | 0.000 |
| 4 spectra, GAVYSFDPVGSYQR | 0.000 | 0.000 | 0.000 | 0.000 | 0.000 | 0.000 | 1.000 | 0.000 | ||
| 2 spectra, DVFISAAER | 0.000 | 0.000 | 0.000 | 0.000 | 0.000 | 0.000 | 0.984 | 0.016 | ||
| 1 spectrum, TVIGCSGFHGDCLTLTK | 0.000 | 0.038 | 0.056 | 0.130 | 0.000 | 0.000 | 0.776 | 0.000 | ||
| 2 spectra, DVYTGDALR | 0.000 | 0.000 | 0.000 | 0.000 | 0.000 | 0.000 | 1.000 | 0.000 | ||
| 9 spectra, NMQNVEHVPLTLDR | 0.000 | 0.217 | 0.000 | 0.000 | 0.078 | 0.018 | 0.688 | 0.000 | ||
| 1 spectrum, LSEGFSIHTR | 0.000 | 0.360 | 0.000 | 0.000 | 0.000 | 0.071 | 0.569 | 0.000 | ||
| 4 spectra, ICIVTK | 0.000 | 0.000 | 0.000 | 0.005 | 0.000 | 0.000 | 0.980 | 0.015 |
| Plot | Mito | Lyso or Perox | ER | Golgi | PM | Cytosol | Nucleus | ||||||
| Expt B |
4 peptides |
13 spectra |
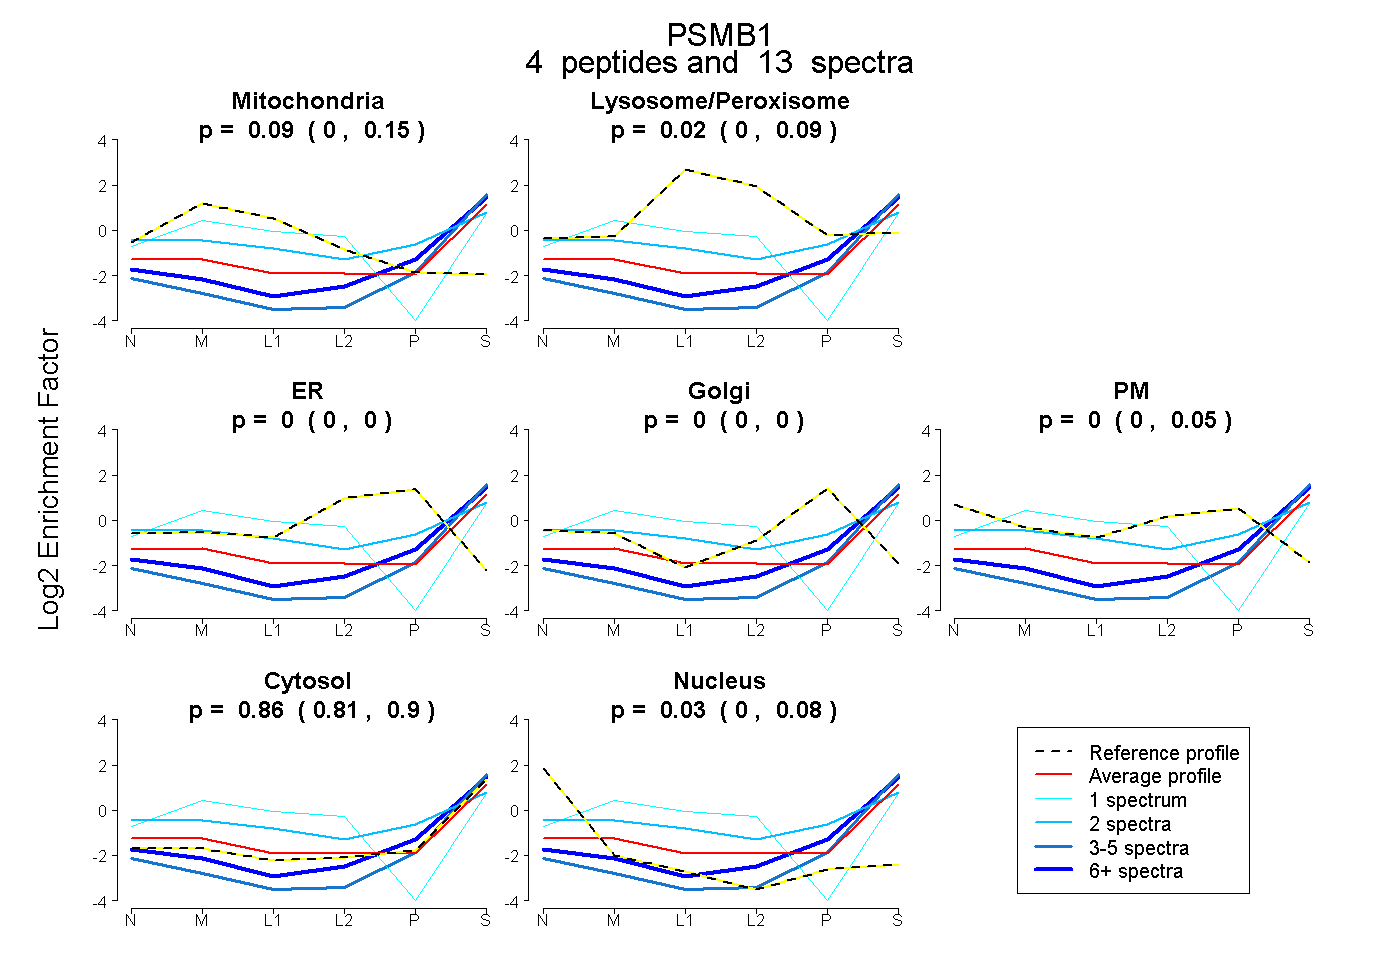 |
0.088 0.000 | 0.150 |
0.020 0.000 | 0.088 |
0.000 0.000 | 0.000 |
0.000 0.000 | 0.000 |
0.000 0.000 | 0.048 |
0.864 0.808 | 0.902 |
0.029 0.000 | 0.078 |
|||
| Plot | Lyso | Other | |||||||||||
| Expt C |
8 peptides |
33 spectra |
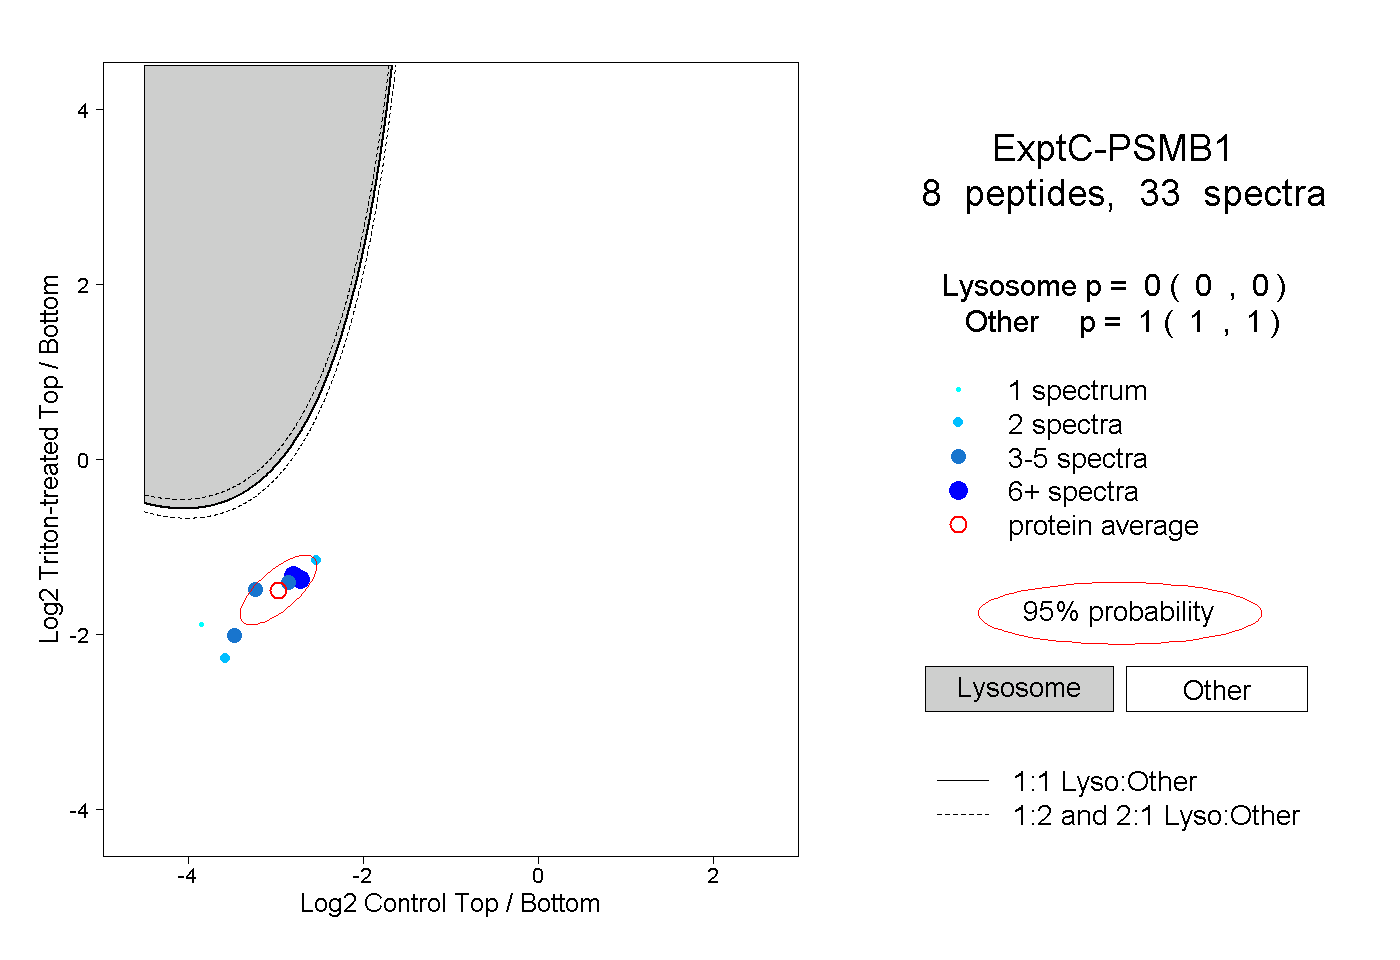 |
0.000 0.000 | 0.000 |
1.000 1.000 | 1.000 |
||||||||
| Plot | Lyso | Other | |||||||||||
| Expt D |
2 peptides |
3 spectra |
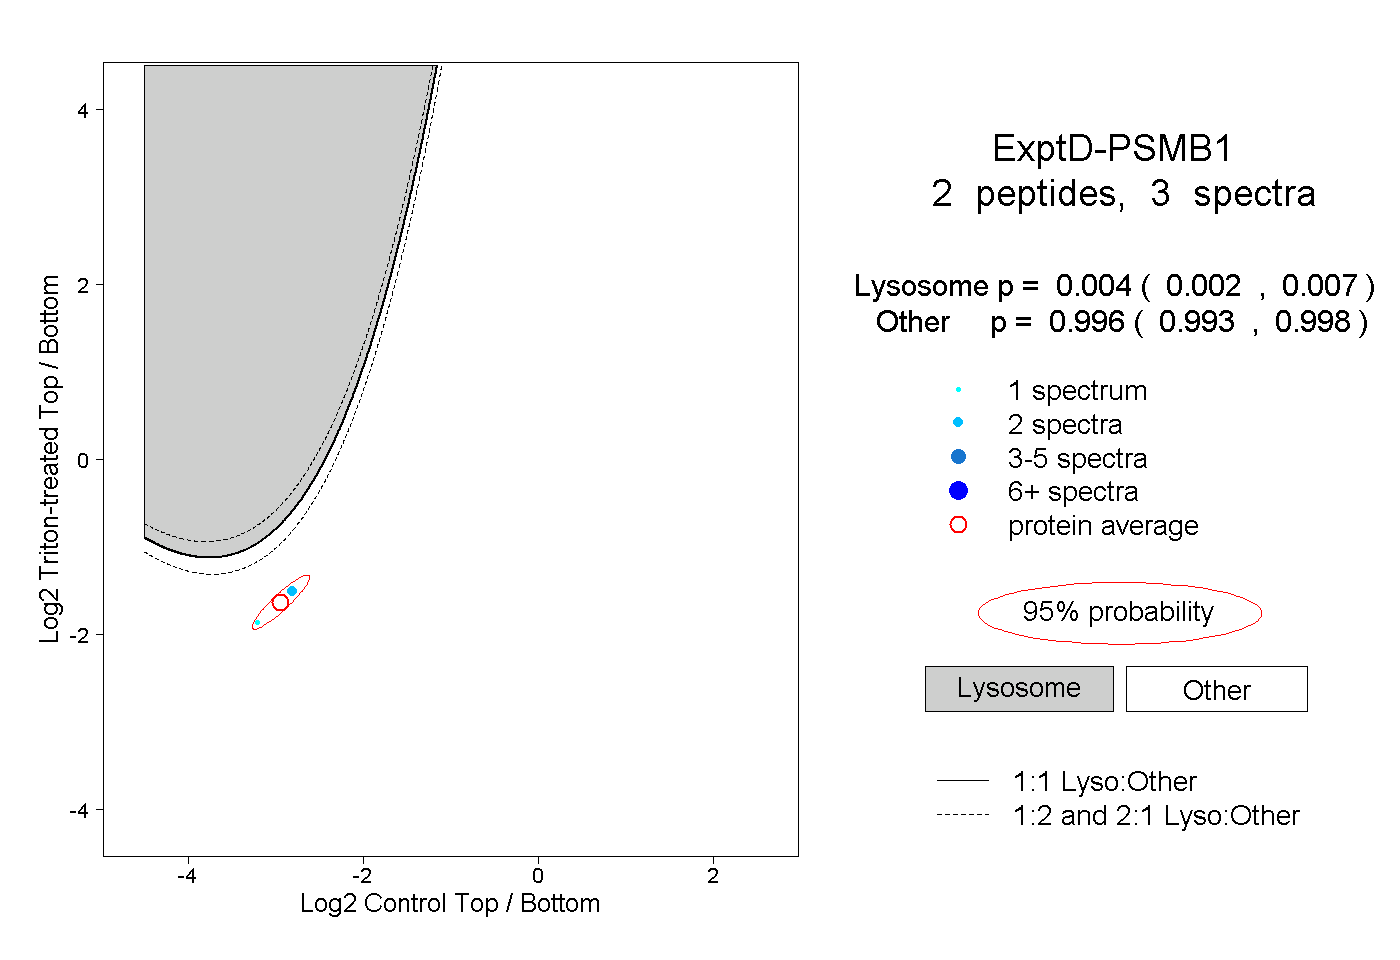 |
0.004 0.002 | 0.007 |
0.996 0.993 | 0.998 |