 4
4peptides
spectra
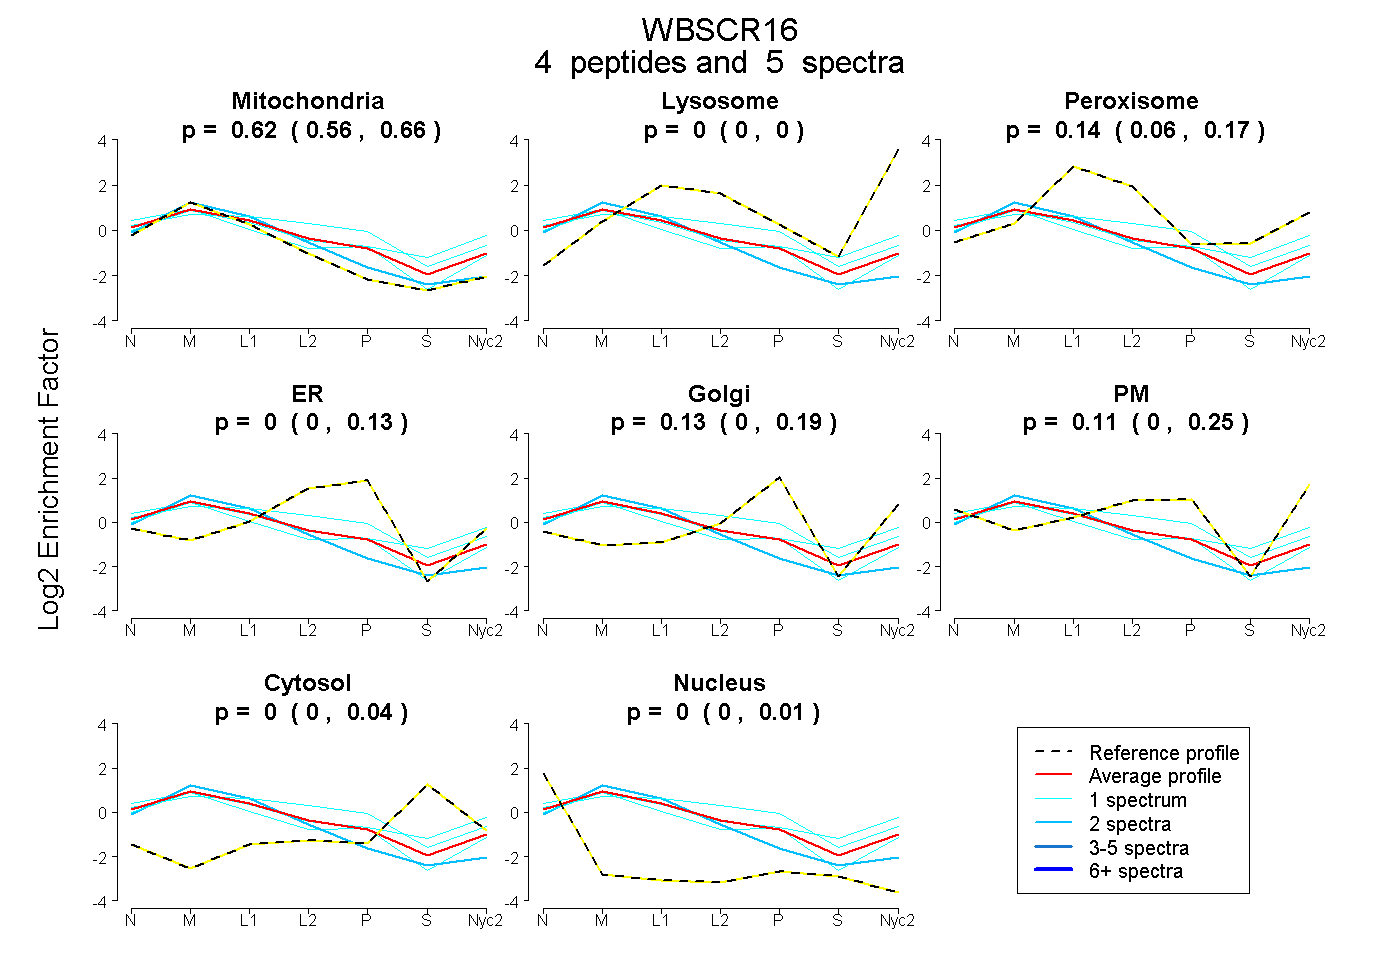
0.563 | 0.661
0.000 | 0.000
0.059 | 0.169
0.000 | 0.129
0.000 | 0.187
0.000 | 0.249
0.000 | 0.044
0.000 | 0.007
1peptide
spectrum
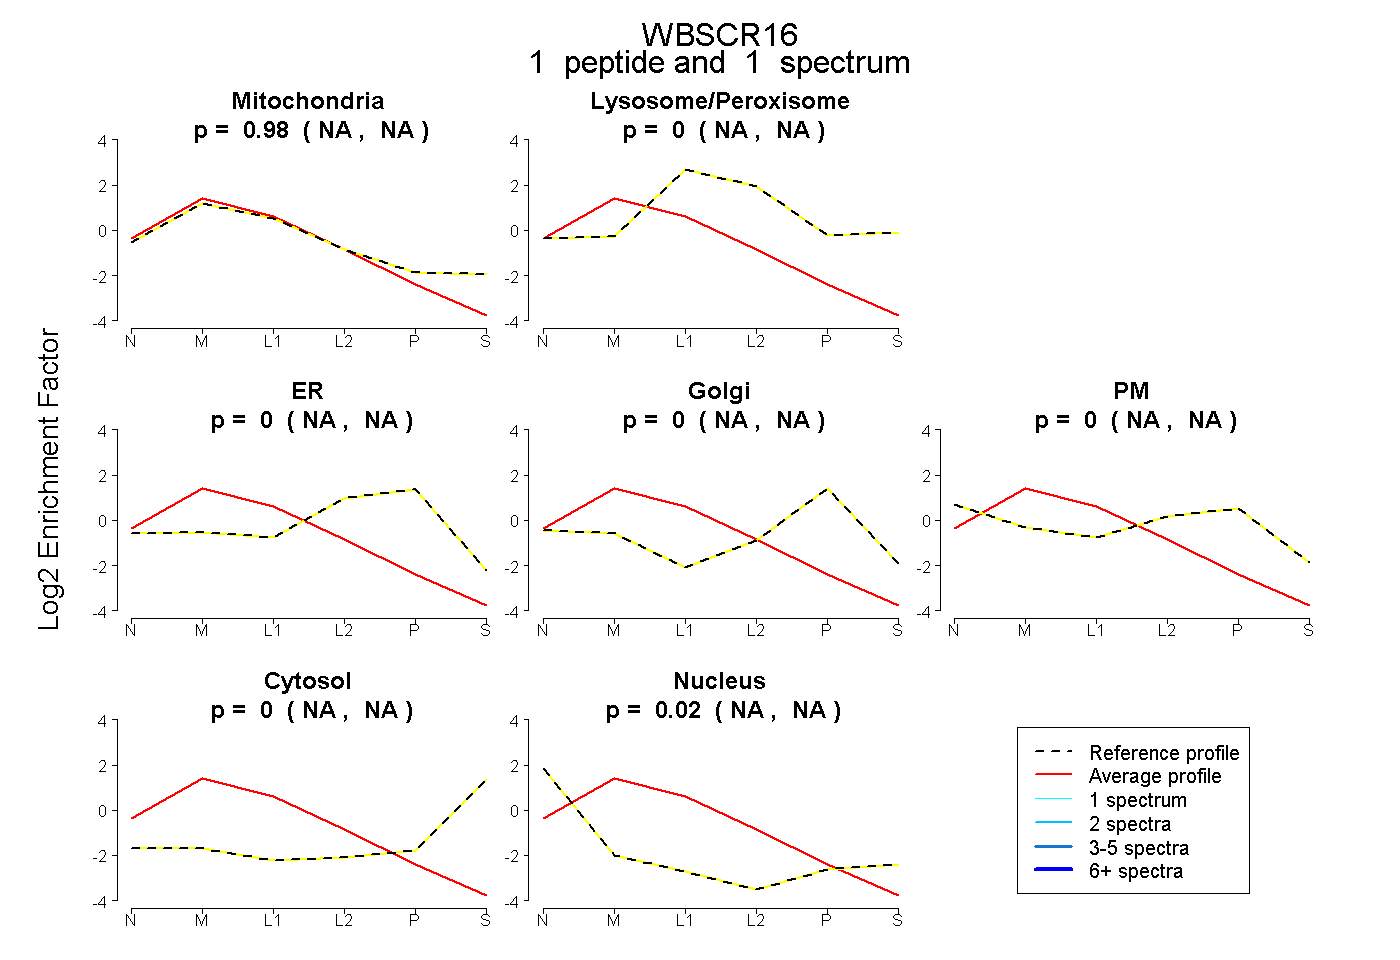
NA | NA
NA | NA
NA | NA
NA | NA
NA | NA
NA | NA
NA | NA
12peptides
spectra
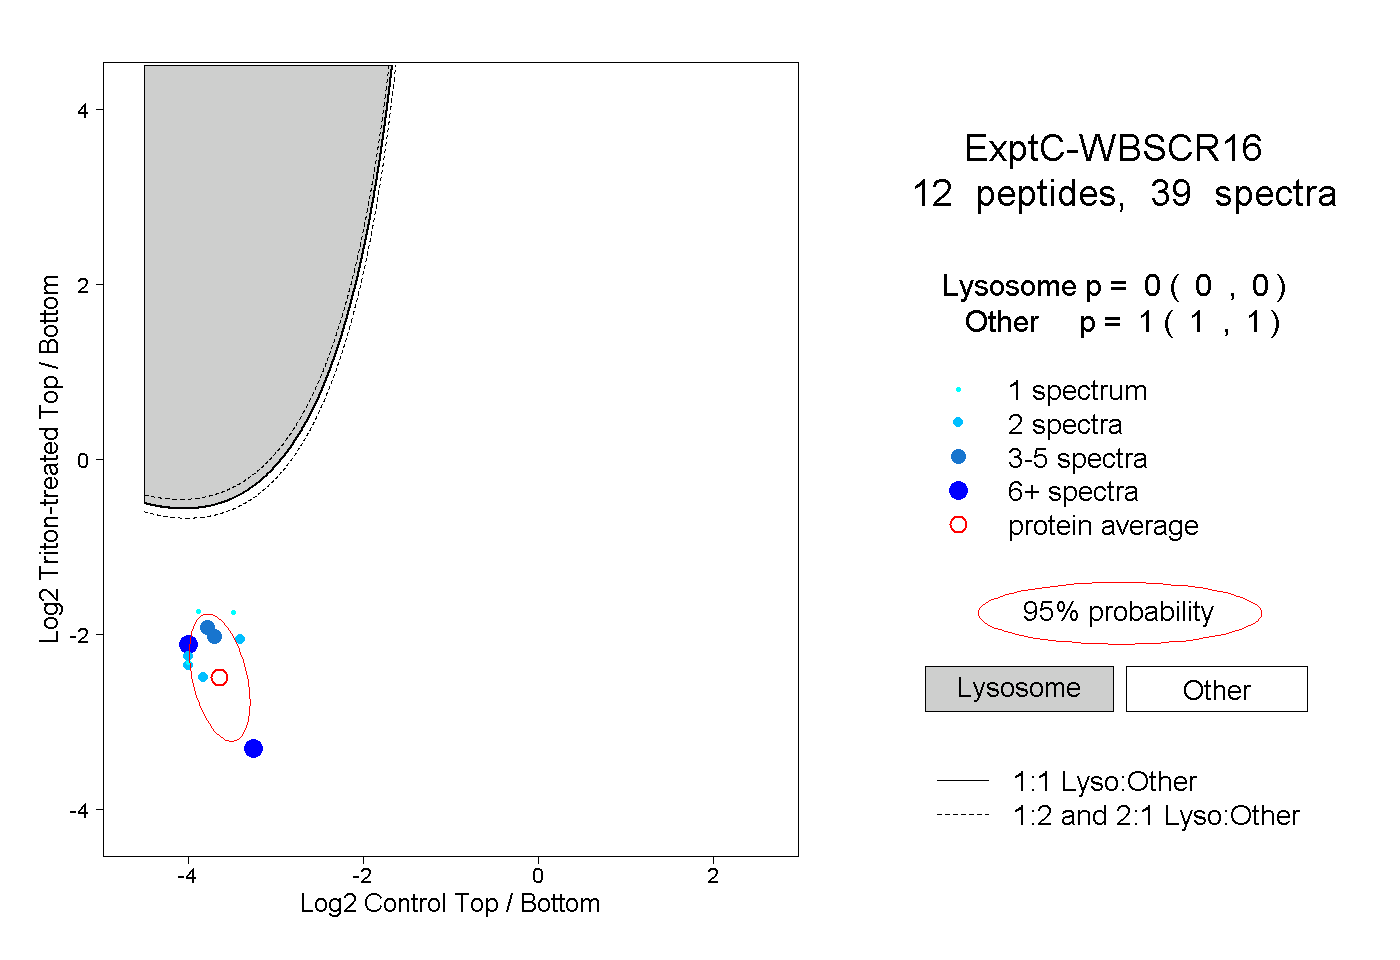
0.000 | 0.000
1.000 | 1.000
3peptides
spectra
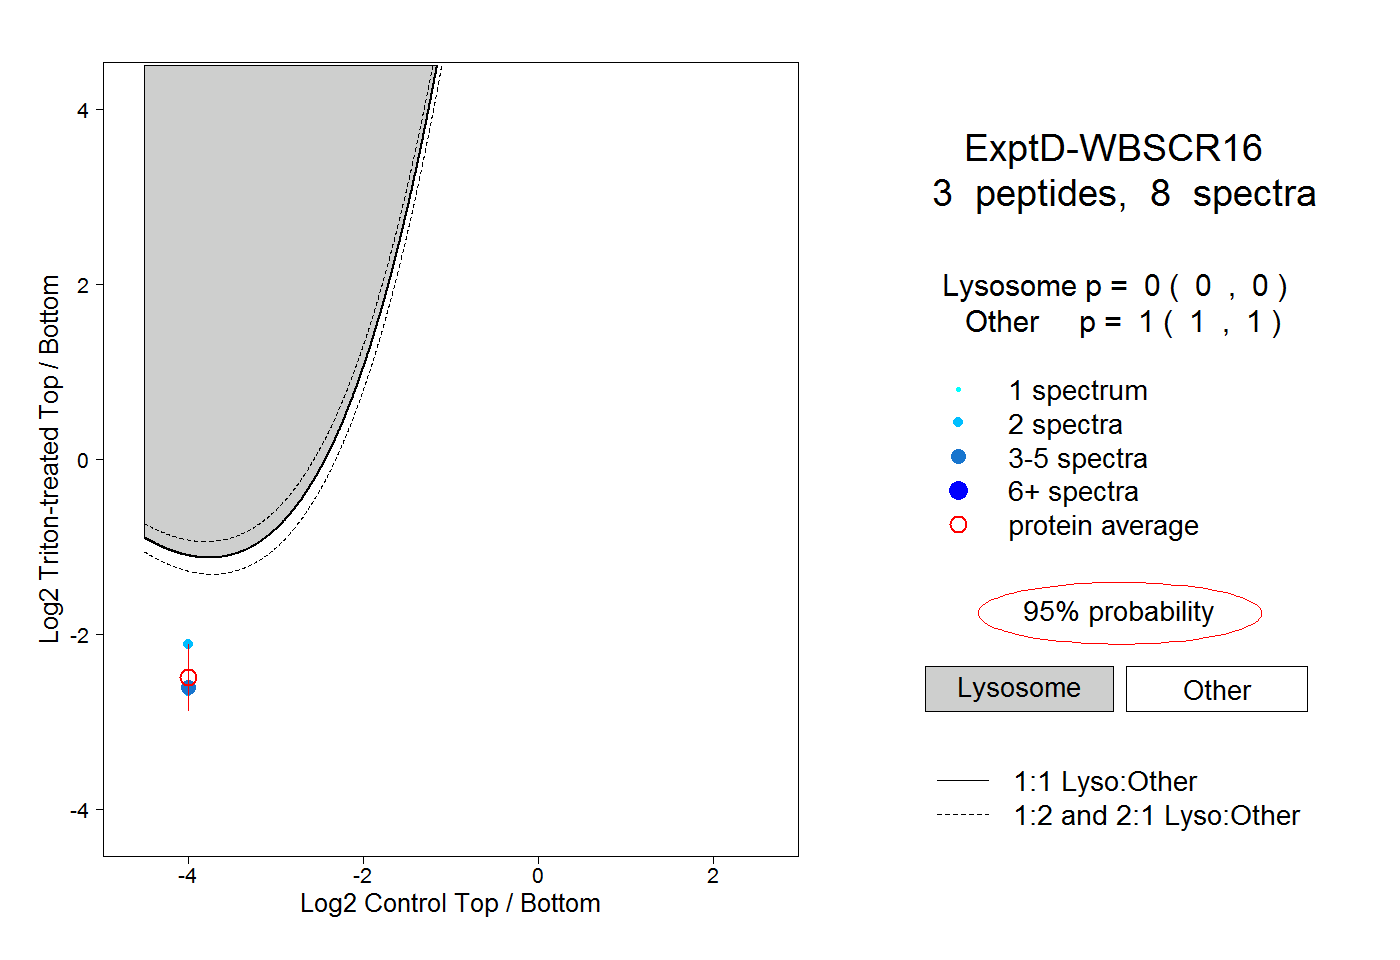
0.000 | 0.000
1.000 | 1.000