 4
4peptides
spectra
0.563 | 0.661
0.000 | 0.000
0.059 | 0.169
0.000 | 0.129
0.000 | 0.187
0.000 | 0.249
0.000 | 0.044
0.000 | 0.007
| Plot | Mito | Lyso | Perox | ER | Golgi | PM | Cytosol | Nucleus | |||||
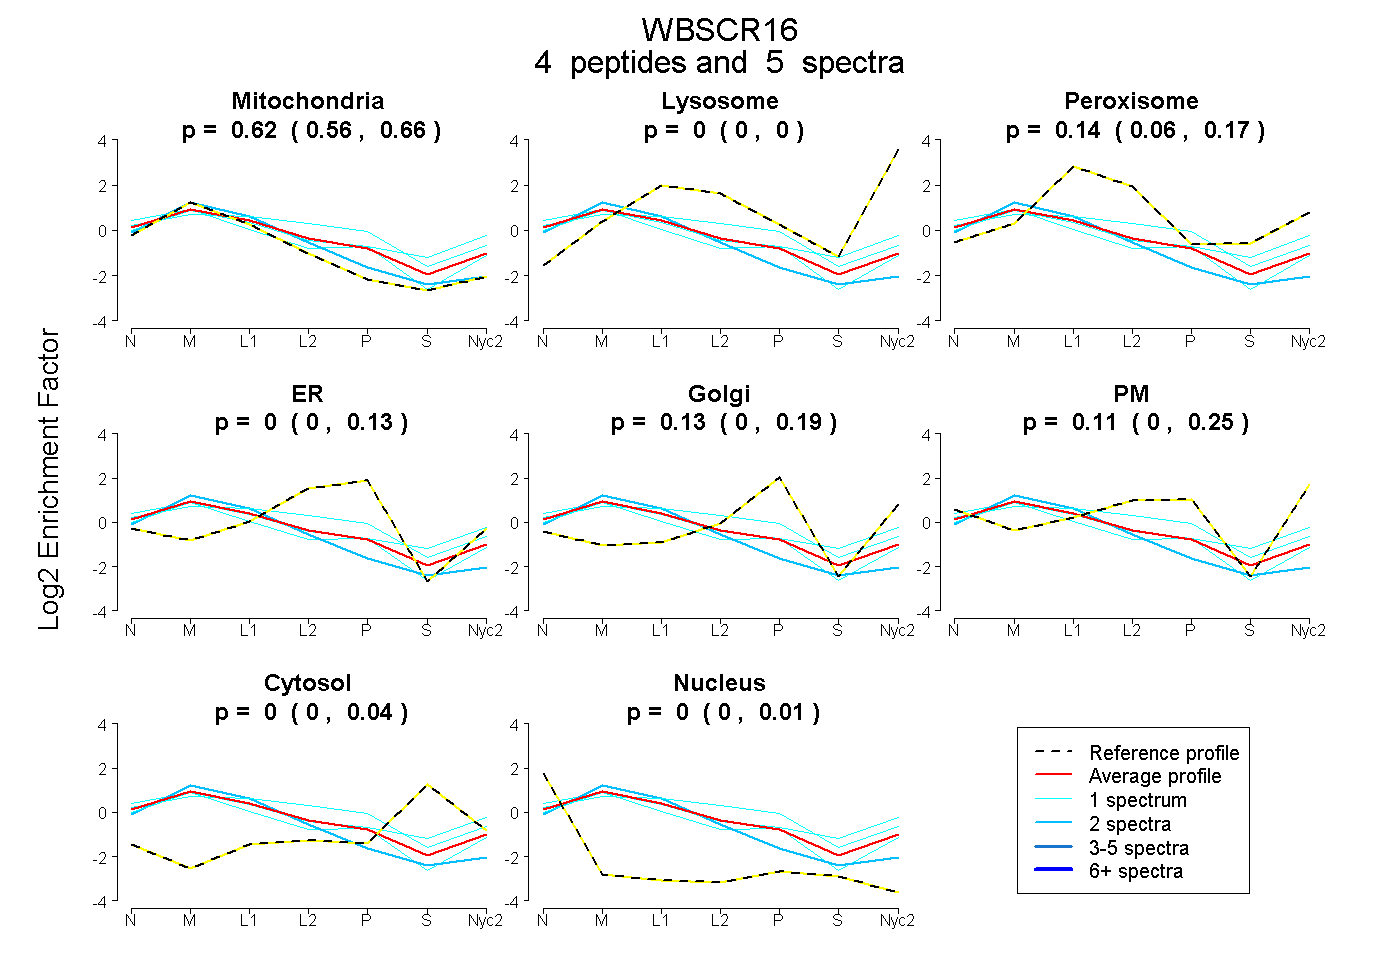
| Expt A |
4 peptides |
5 spectra |
|
0.621 0.563 | 0.661 |
0.000 0.000 | 0.000 |
0.137 0.059 | 0.169 |
0.000 0.000 | 0.129 |
0.133 0.000 | 0.187 |
0.110 0.000 | 0.249 |
0.000 0.000 | 0.044 |
0.000 0.000 | 0.007 |
| 1 spectrum, VVEDEVYSESHK | 0.394 | 0.000 | 0.229 | 0.187 | 0.064 | 0.113 | 0.012 | 0.000 | ||
| 1 spectrum, VLQVSCGR | 0.474 | 0.089 | 0.100 | 0.000 | 0.000 | 0.213 | 0.125 | 0.000 | ||
| 2 spectra, GCLGIGR | 0.859 | 0.000 | 0.083 | 0.058 | 0.000 | 0.000 | 0.000 | 0.000 | ||
| 1 spectrum, AHSLVLTDR | 0.659 | 0.000 | 0.000 | 0.000 | 0.107 | 0.207 | 0.000 | 0.027 |
| Plot | Mito | Lyso or Perox | ER | Golgi | PM | Cytosol | Nucleus | ||||||
| Expt B |
1 peptide |
1 spectrum |
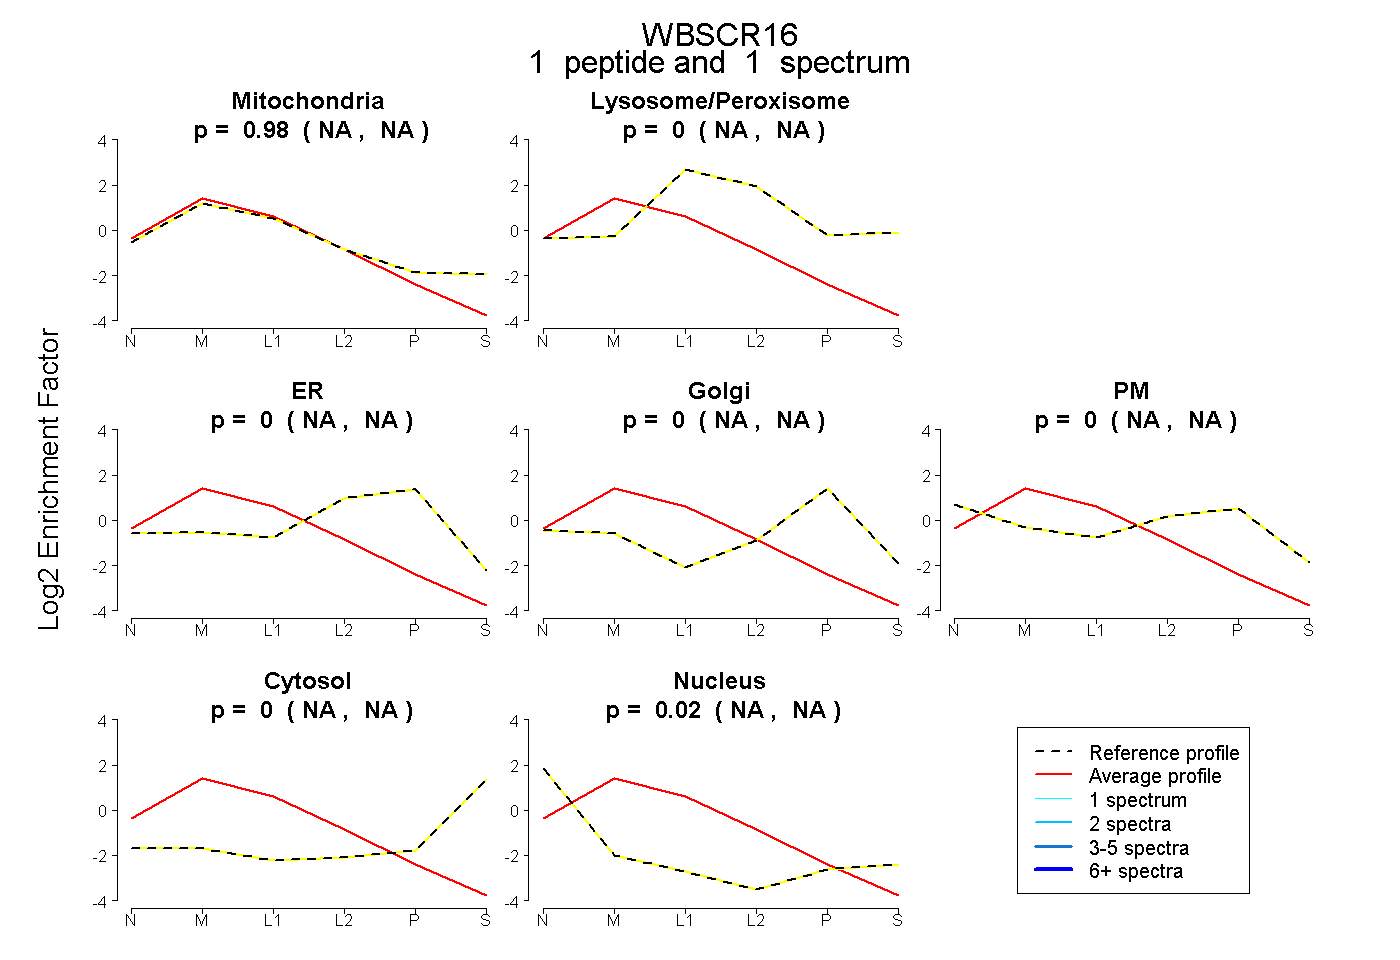 |
0.979 NA | NA |
0.000 NA | NA |
0.000 NA | NA |
0.000 NA | NA |
0.000 NA | NA |
0.000 NA | NA |
0.021 NA | NA |
|||
| Plot | Lyso | Other | |||||||||||
| Expt C |
12 peptides |
39 spectra |
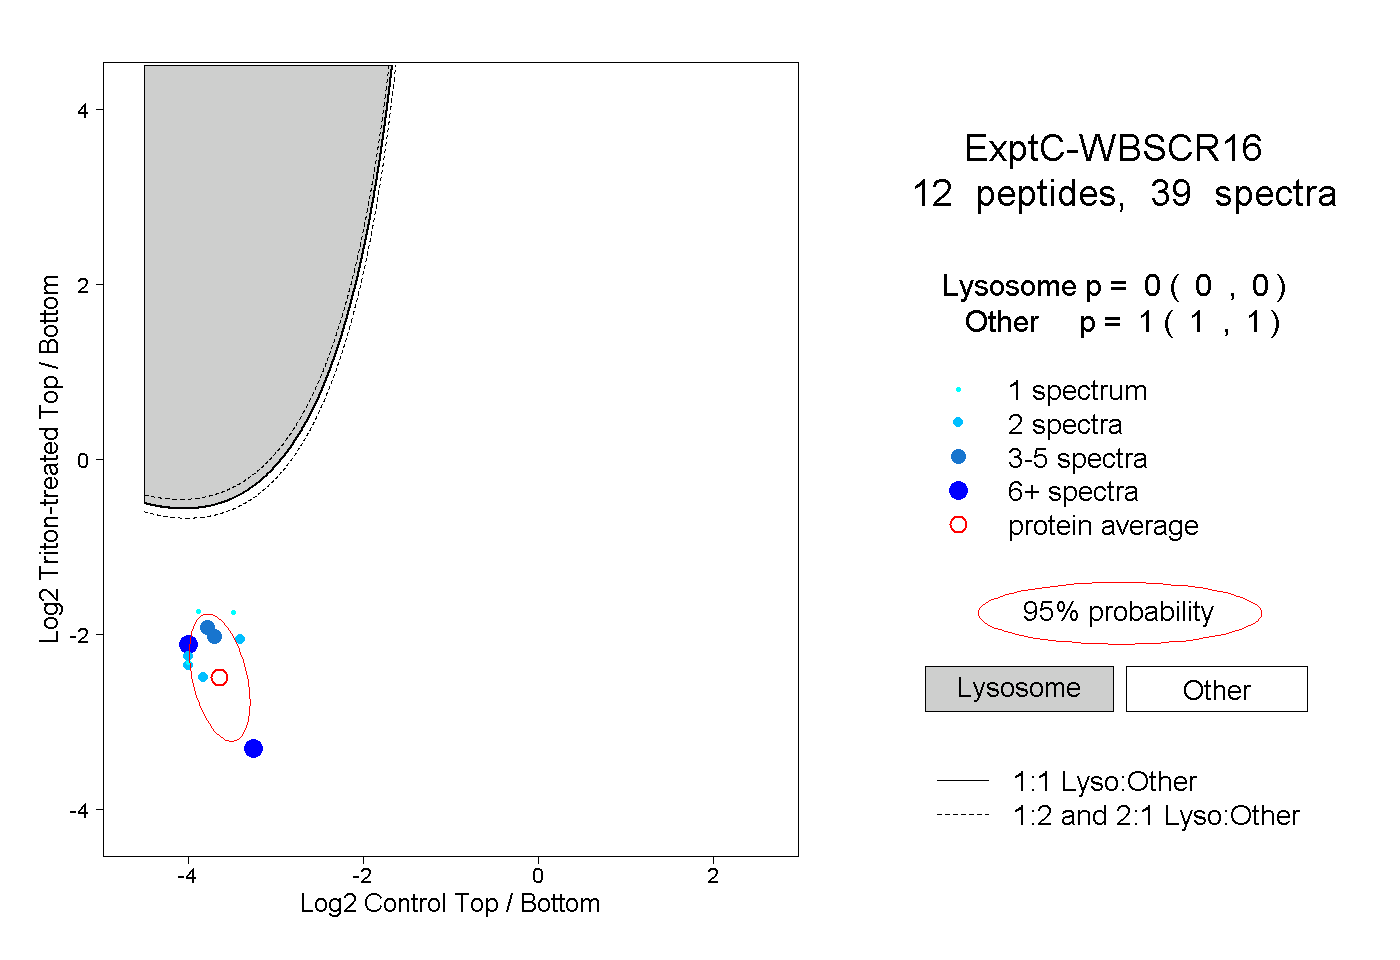 |
0.000 0.000 | 0.000 |
1.000 1.000 | 1.000 |
||||||||
| Plot | Lyso | Other | |||||||||||
| Expt D |
3 peptides |
8 spectra |
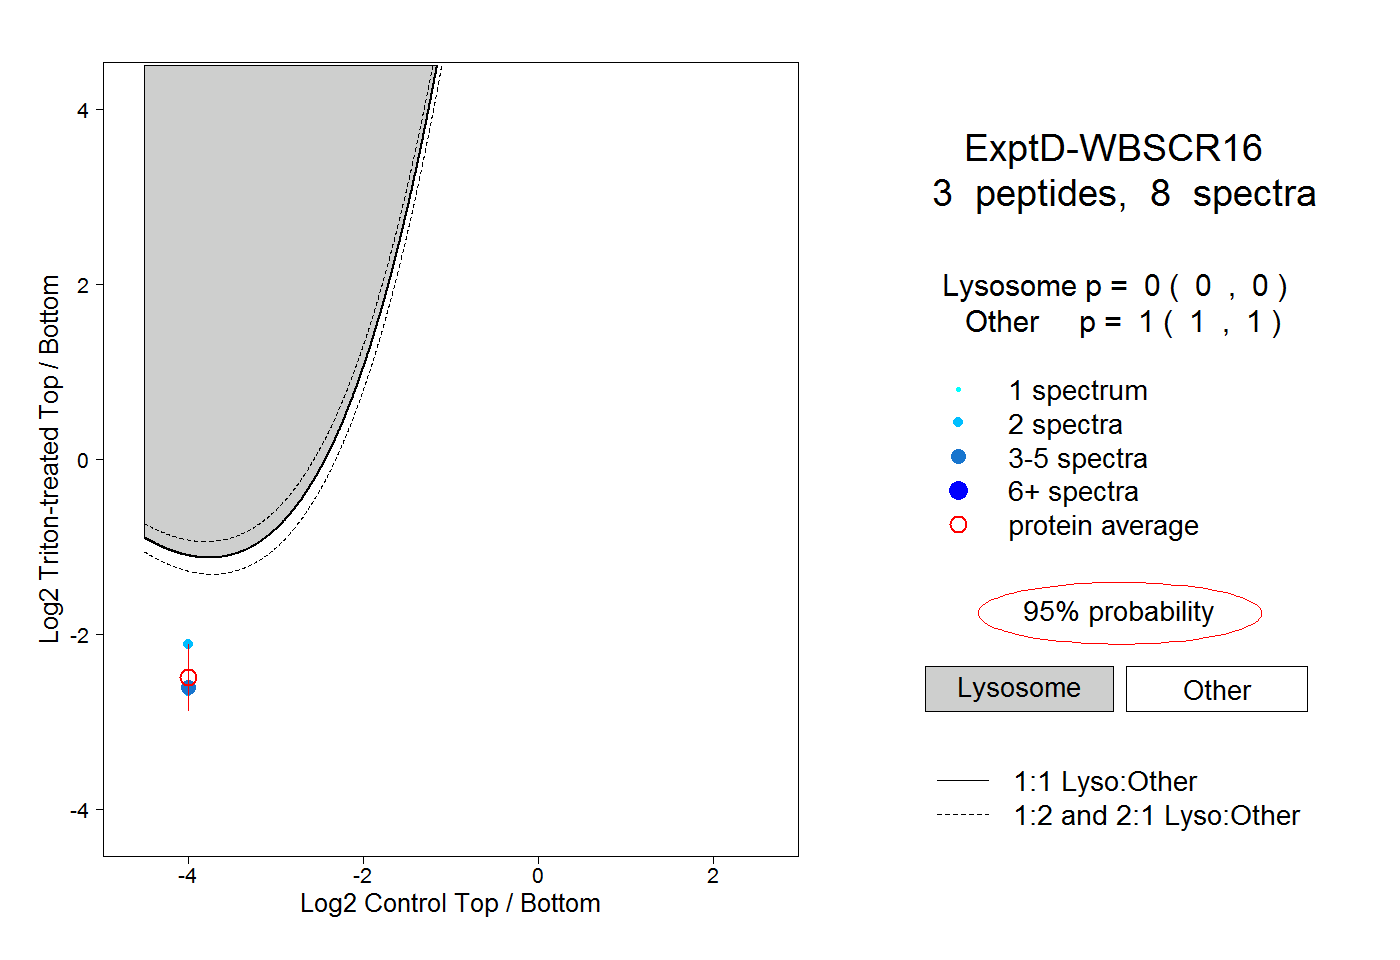 |
0.000 0.000 | 0.000 |
1.000 1.000 | 1.000 |