 5
5peptides
spectra
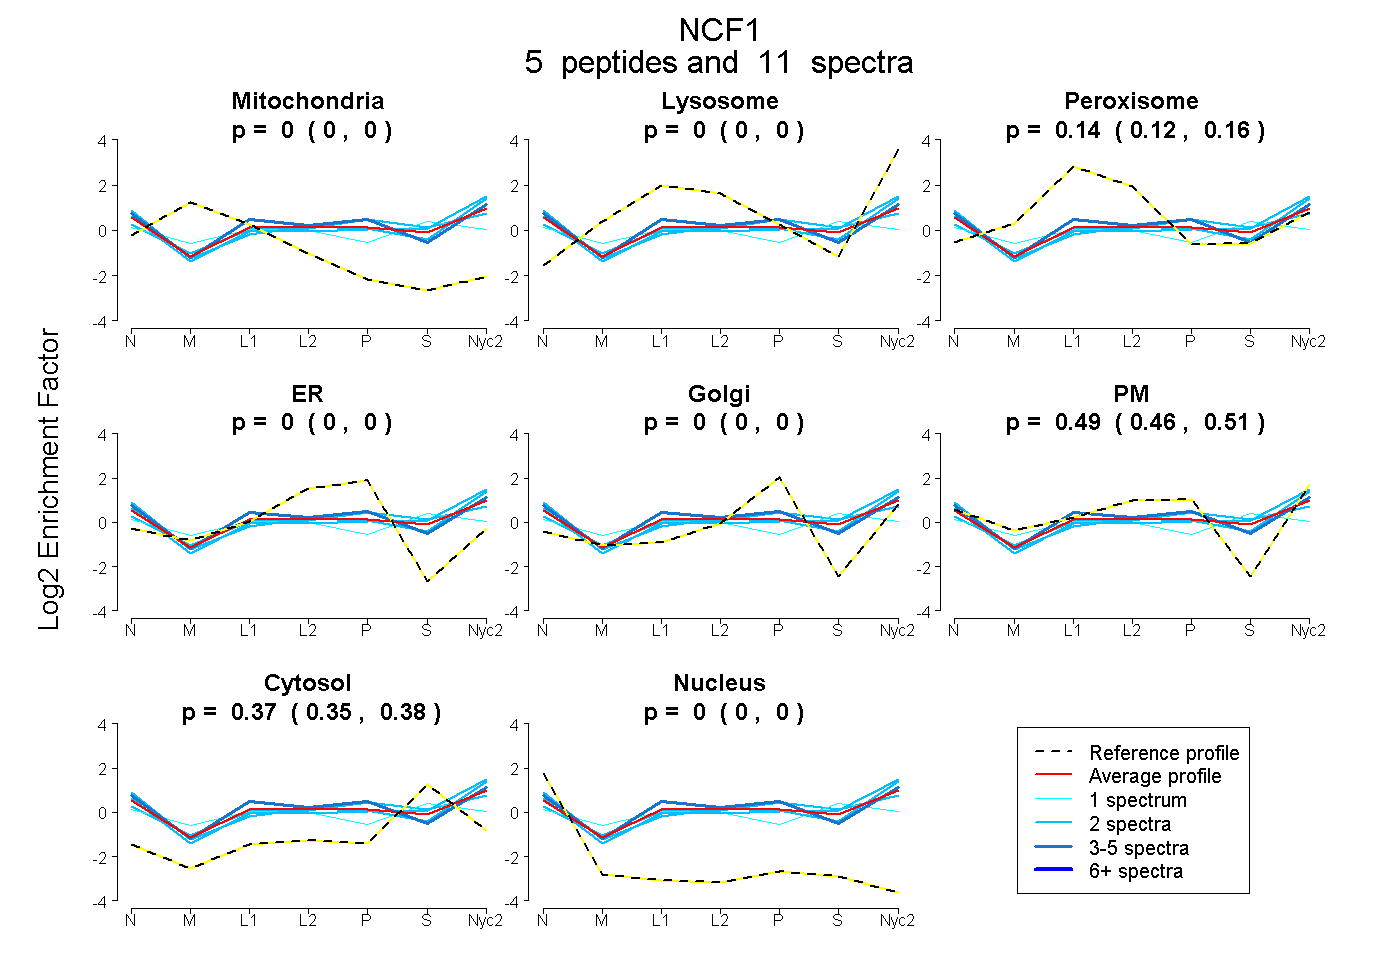
0.000 | 0.000
0.000 | 0.000
0.118 | 0.165
0.000 | 0.000
0.000 | 0.000
0.461 | 0.513
0.350 | 0.379
0.000 | 0.000
4peptides
spectra
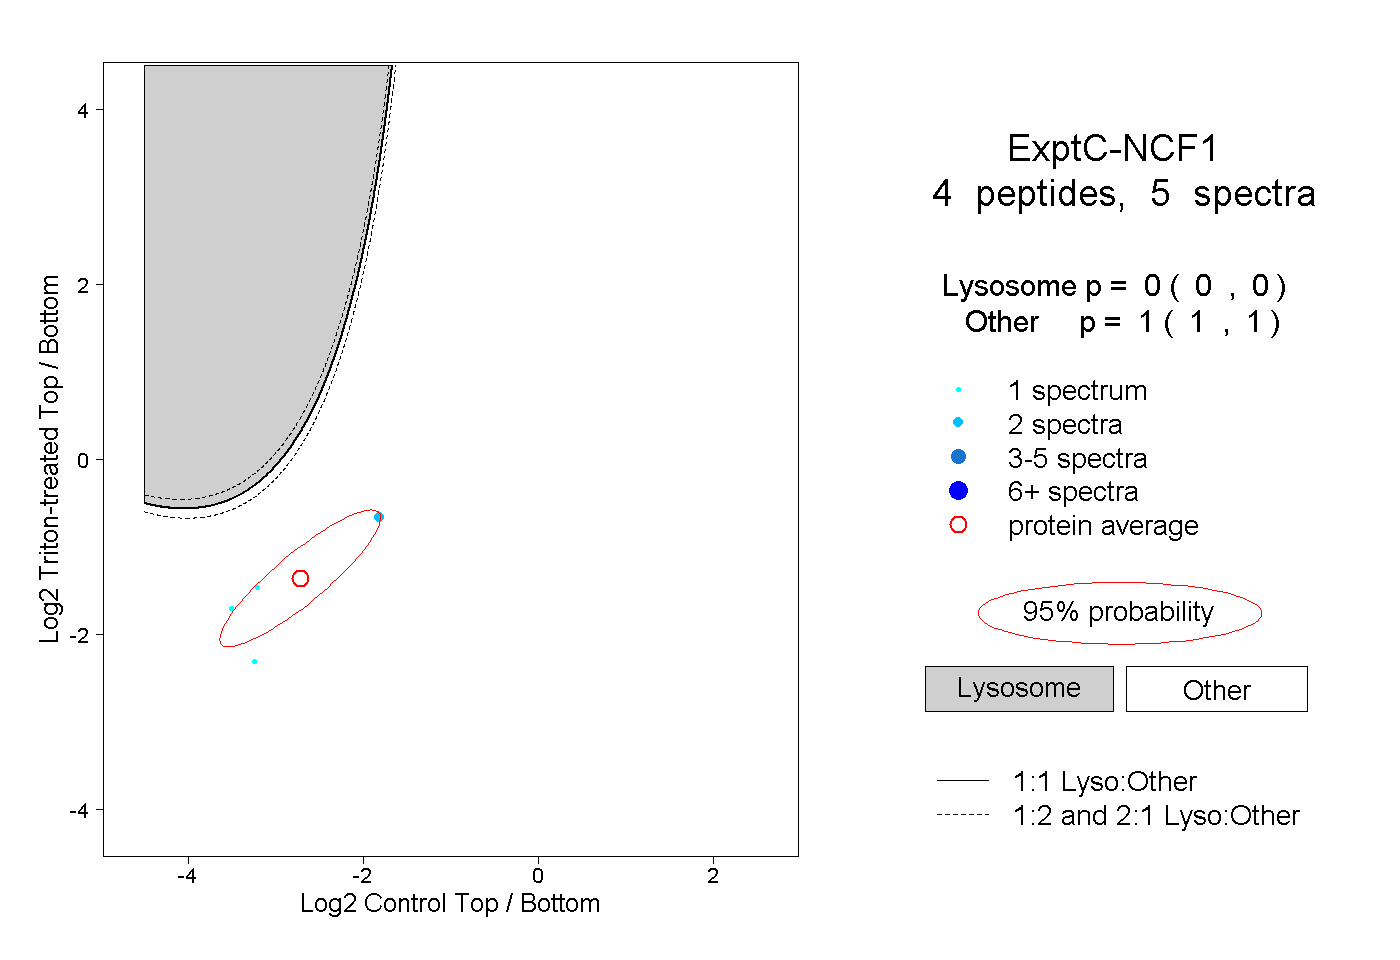
0.000 | 0.000
1.000 | 1.000
1peptide
spectrum
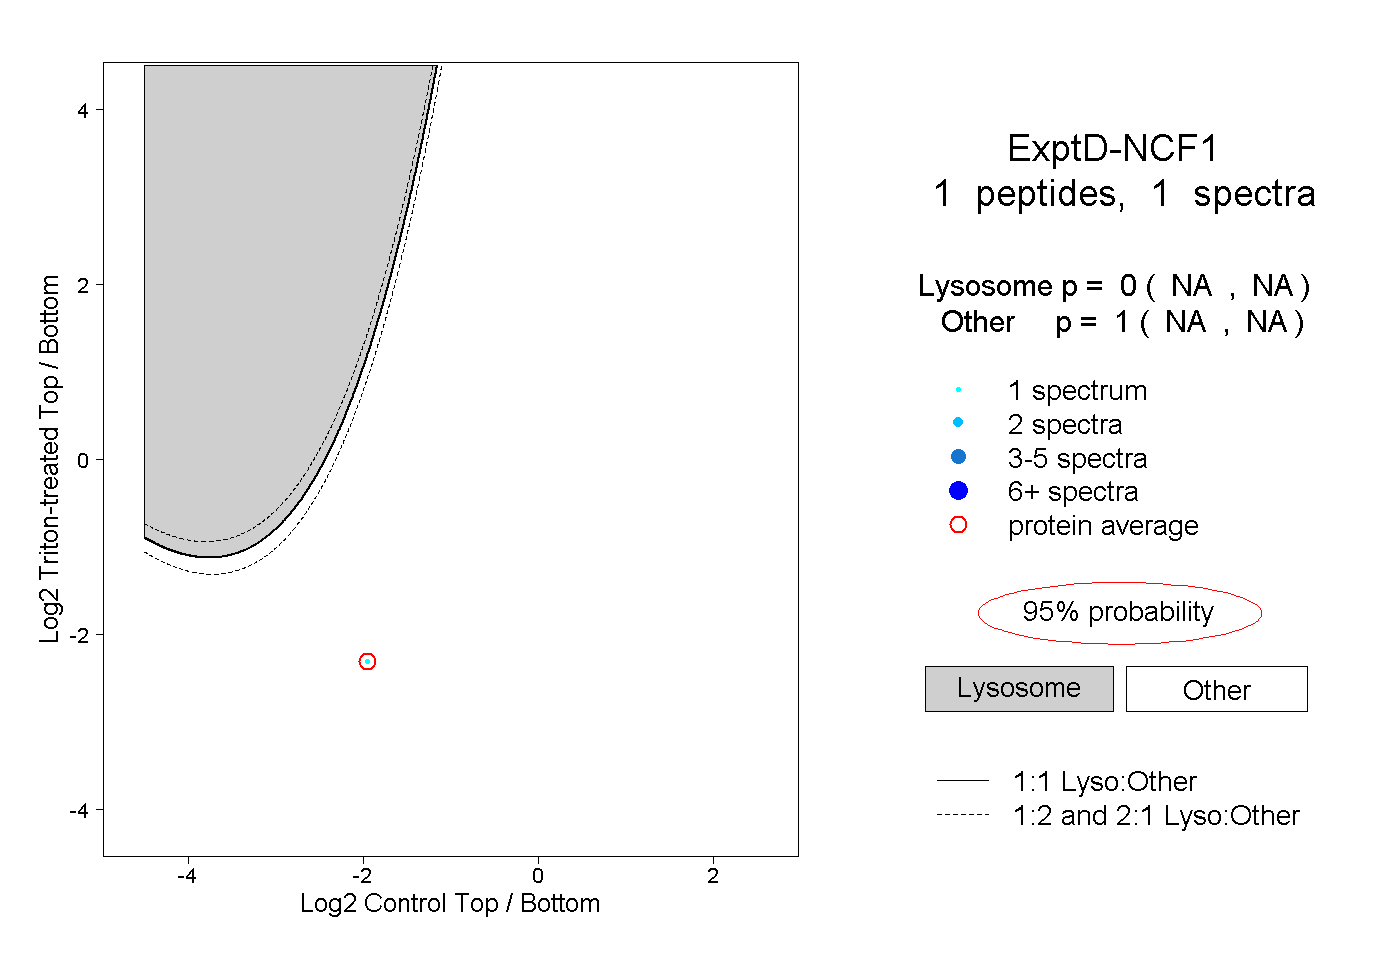
NA | NA
NA | NA