 5
5peptides
spectra
0.000 | 0.000
0.000 | 0.000
0.118 | 0.165
0.000 | 0.000
0.000 | 0.000
0.461 | 0.513
0.350 | 0.379
0.000 | 0.000
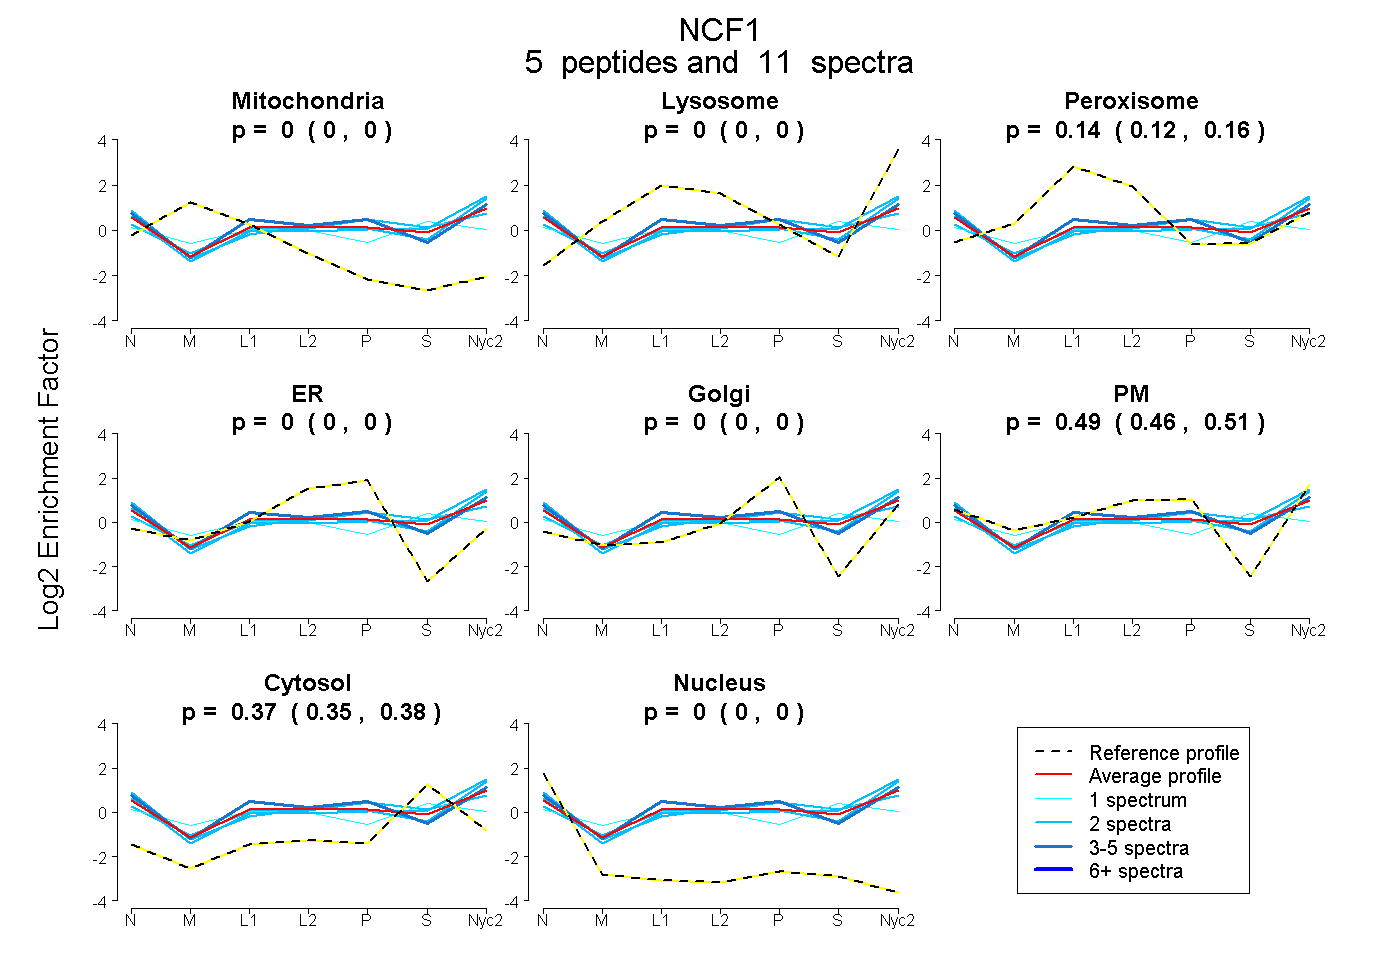
| Plot | Mito | Lyso | Perox | ER | Golgi | PM | Cytosol | Nucleus | |||||
| Expt A |
5 peptides |
11 spectra |
|
0.000 0.000 | 0.000 |
0.000 0.000 | 0.000 |
0.144 0.118 | 0.165 |
0.000 0.000 | 0.000 |
0.000 0.000 | 0.000 |
0.490 0.461 | 0.513 |
0.366 0.350 | 0.379 |
0.000 0.000 | 0.000 |
| 2 spectra, RPARPGPQSPDSK | 0.000 | 0.112 | 0.007 | 0.000 | 0.000 | 0.477 | 0.404 | 0.000 | ||
| 2 spectra, EMFPIEAGEIHTENR | 0.000 | 0.000 | 0.137 | 0.000 | 0.000 | 0.470 | 0.393 | 0.000 | ||
| 4 spectra, VIPHLPAPR | 0.000 | 0.000 | 0.134 | 0.000 | 0.000 | 0.591 | 0.274 | 0.000 | ||
| 2 spectra, LLDGWWVVR | 0.000 | 0.000 | 0.030 | 0.000 | 0.000 | 0.637 | 0.333 | 0.000 | ||
| 1 spectrum, HIALLGFEK | 0.038 | 0.000 | 0.293 | 0.000 | 0.000 | 0.208 | 0.447 | 0.013 |
| Plot | Lyso | Other | |||||||||||
| Expt C |
4 peptides |
5 spectra |
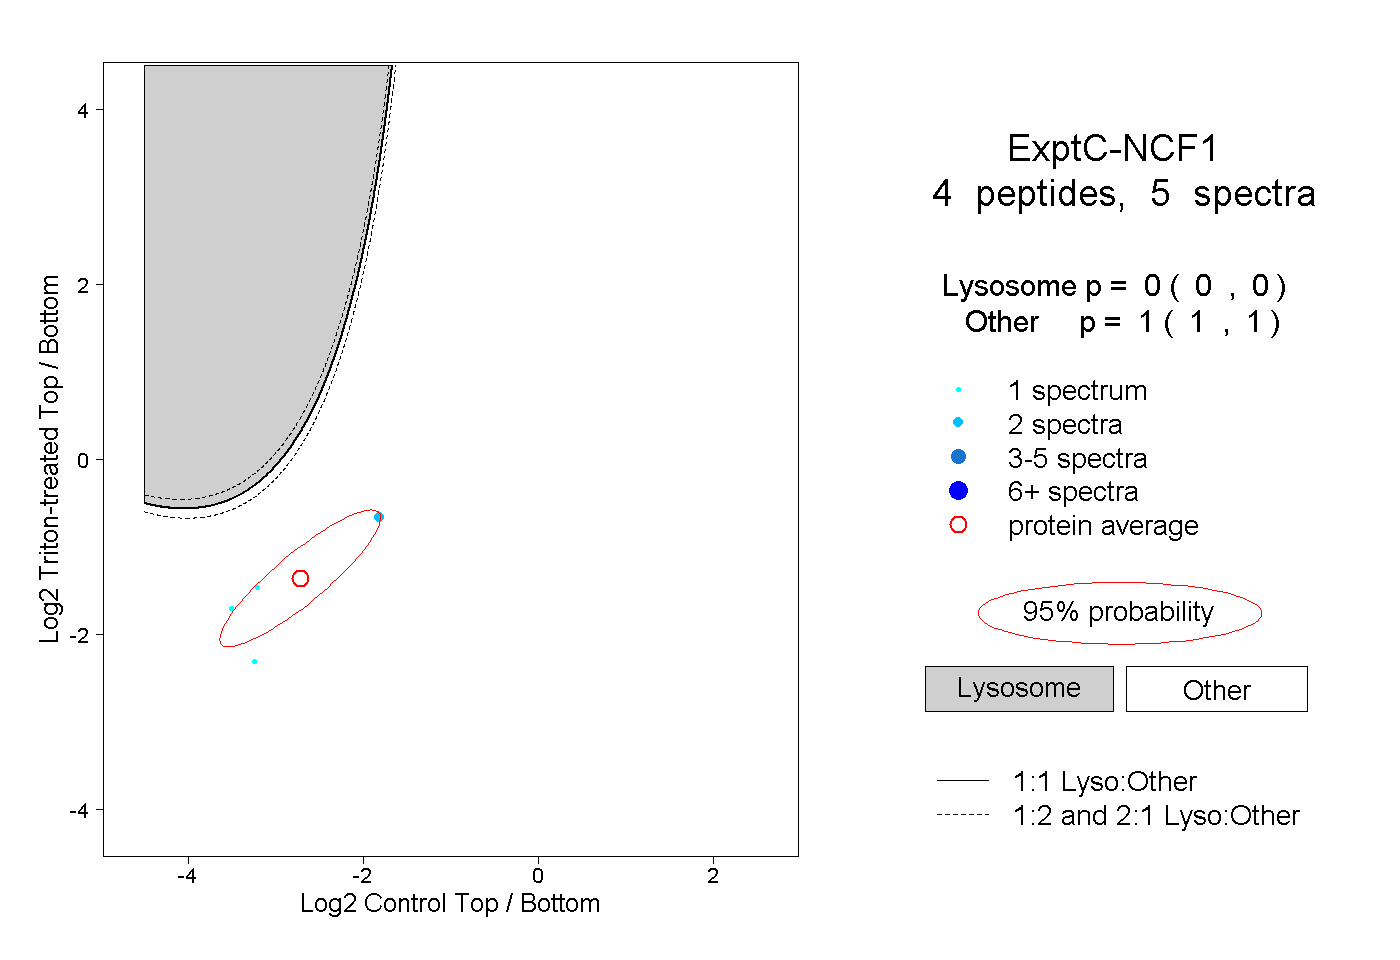 |
0.000 0.000 | 0.000 |
1.000 1.000 | 1.000 |
||||||||
| Plot | Lyso | Other | |||||||||||
| Expt D |
1 peptide |
1 spectrum |
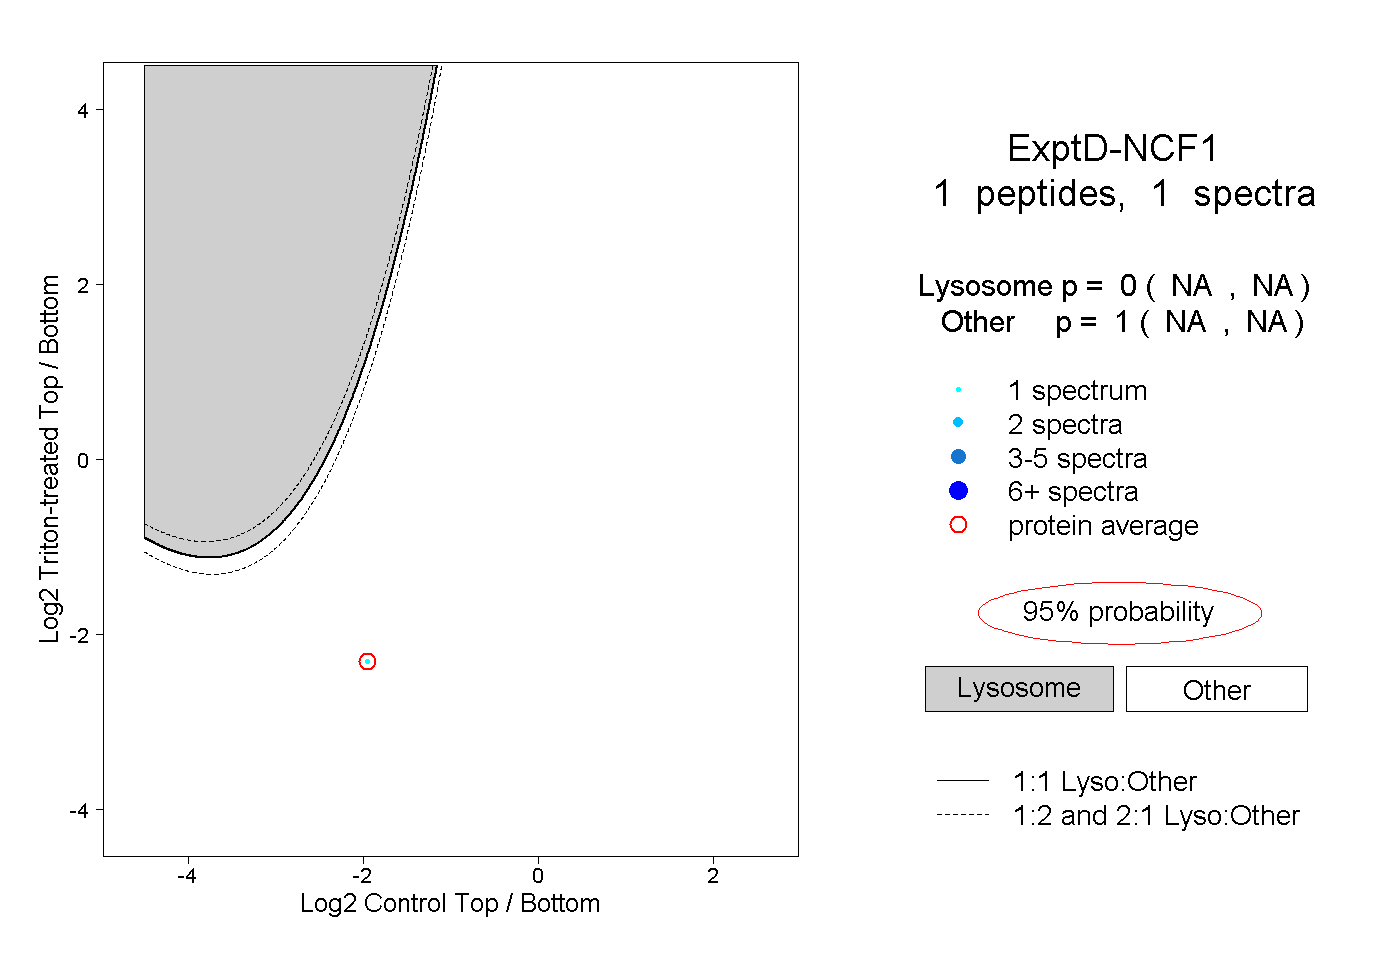 |
0.000 NA | NA |
1.000 NA | NA |