 4
4peptides
spectra
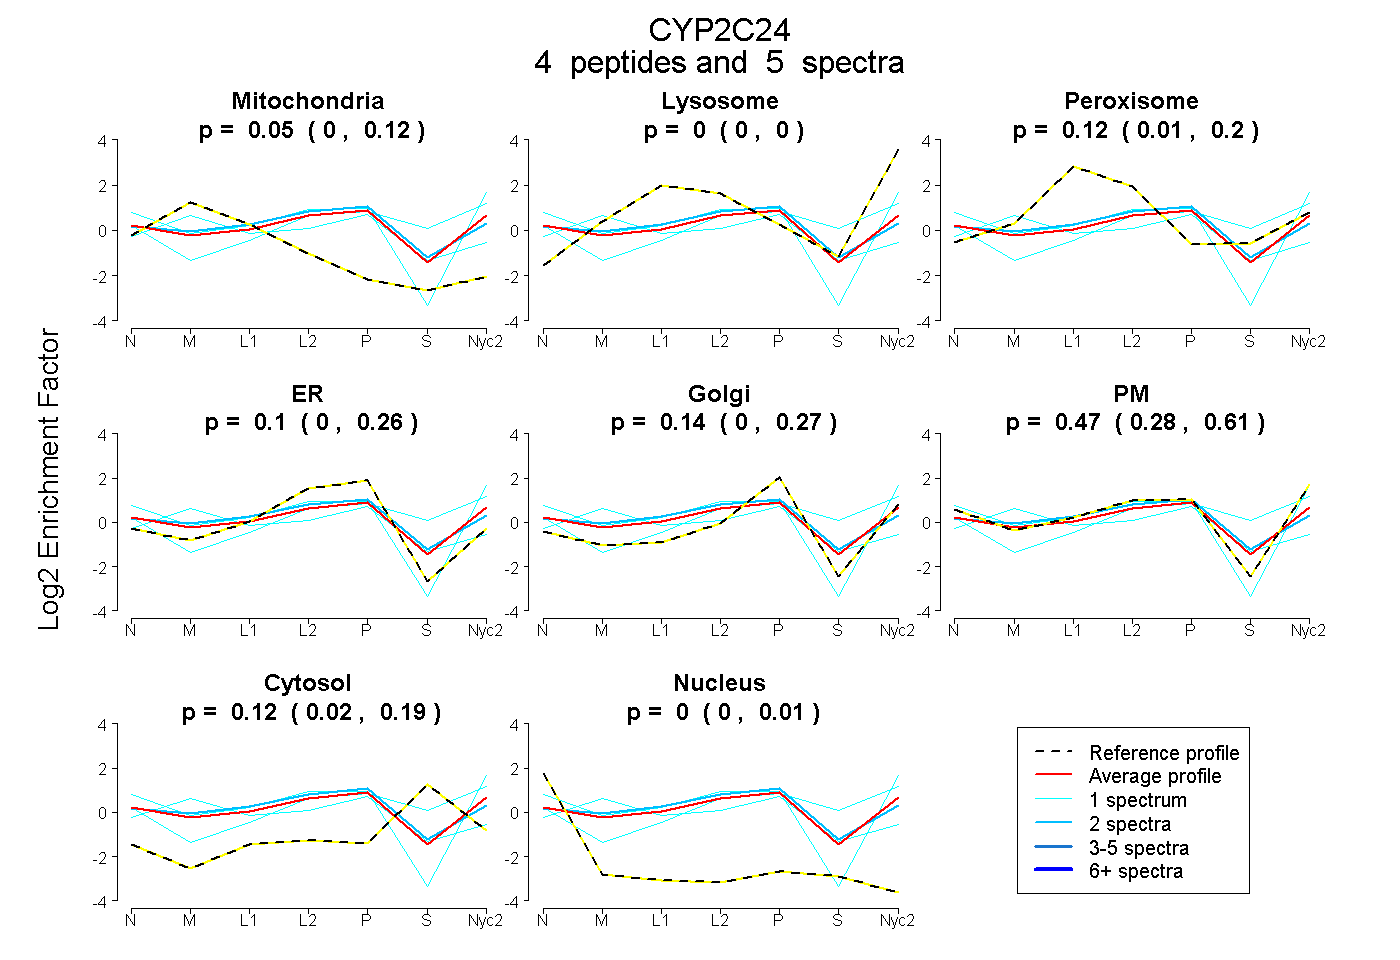
0.000 | 0.118
0.000 | 0.000
0.010 | 0.203
0.000 | 0.255
0.000 | 0.271
0.284 | 0.613
0.019 | 0.186
0.000 | 0.007
2peptides
spectra
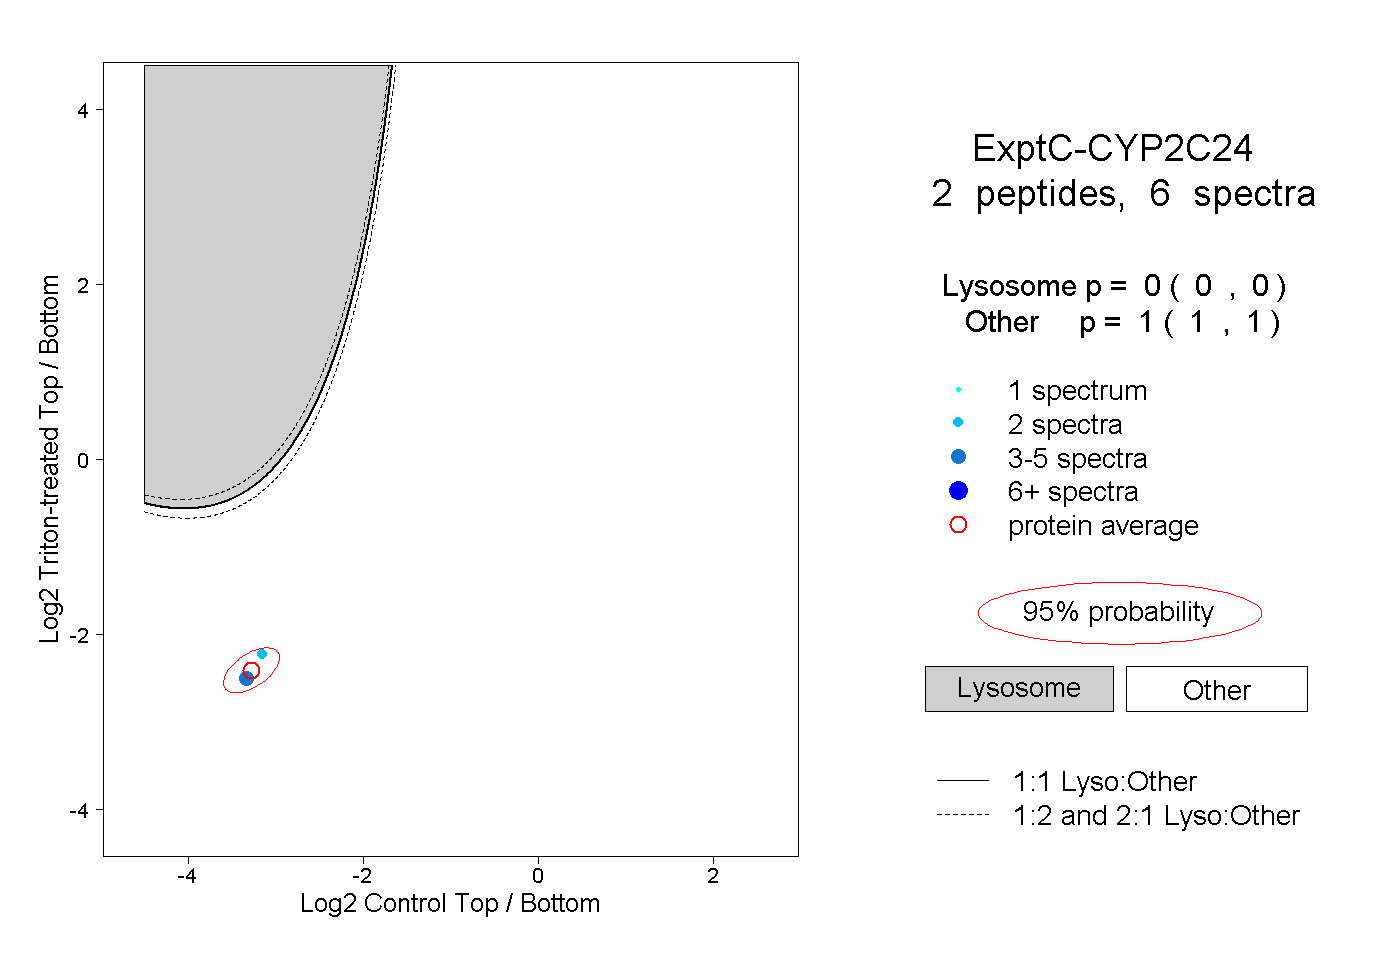
0.000 | 0.000
1.000 | 1.000
1peptide
spectrum
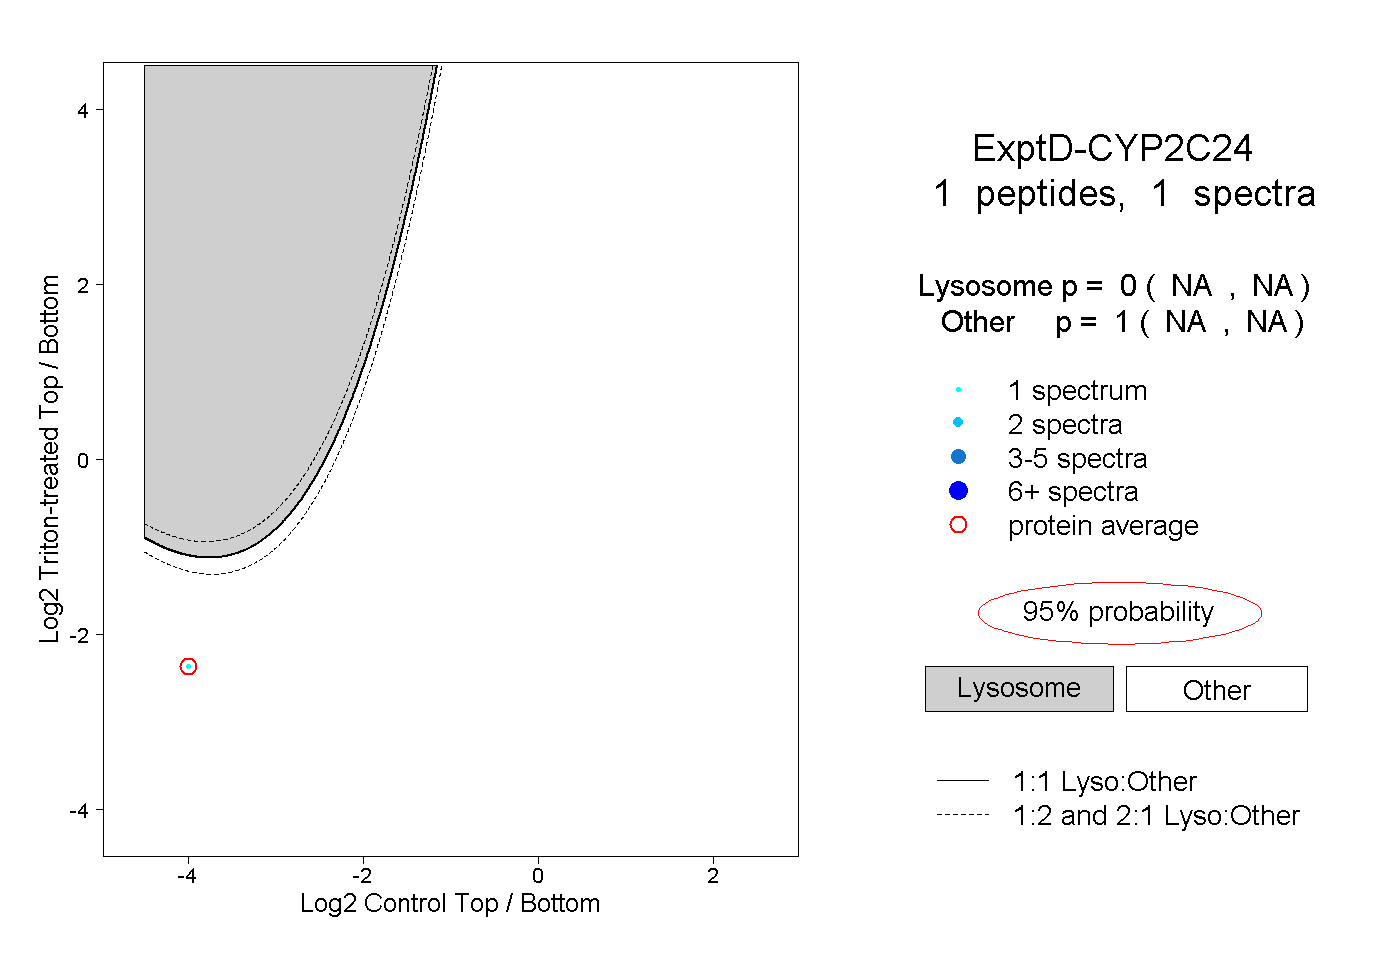
NA | NA
NA | NA