 4
4peptides
spectra
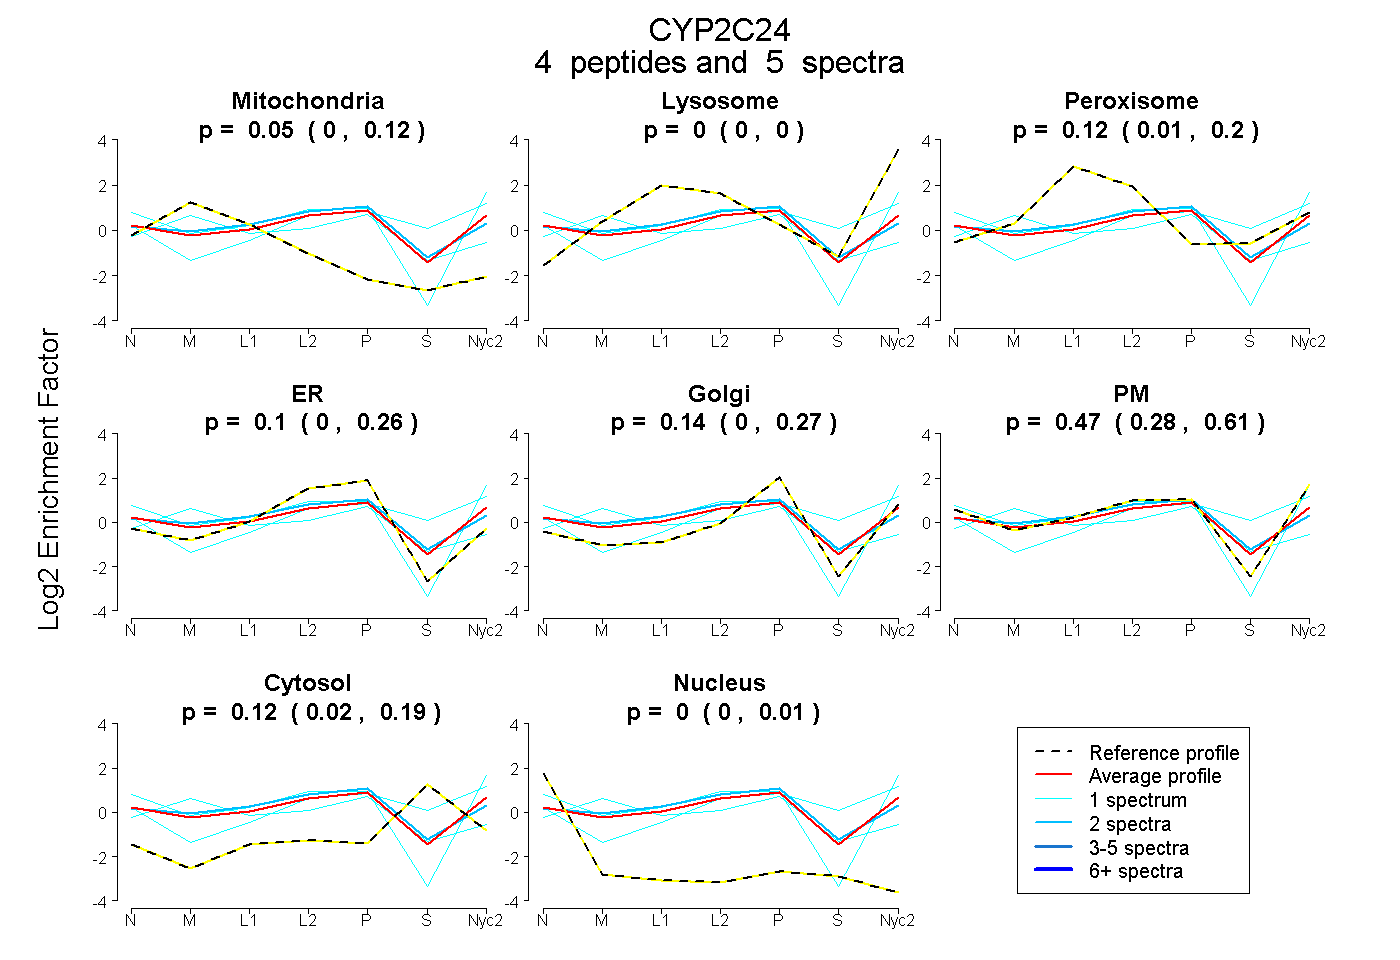
0.000 | 0.118
0.000 | 0.000
0.010 | 0.203
0.000 | 0.255
0.000 | 0.271
0.284 | 0.613
0.019 | 0.186
0.000 | 0.007
| Plot | Mito | Lyso | Perox | ER | Golgi | PM | Cytosol | Nucleus | |||||
| Expt A |
4 peptides |
5 spectra |
|
0.049 0.000 | 0.118 |
0.000 0.000 | 0.000 |
0.120 0.010 | 0.203 |
0.104 0.000 | 0.255 |
0.139 0.000 | 0.271 |
0.472 0.284 | 0.613 |
0.116 0.019 | 0.186 |
0.000 0.000 | 0.007 |
| 2 spectra, YINLIPNNVPHAATCNVR | 0.044 | 0.000 | 0.226 | 0.231 | 0.174 | 0.238 | 0.088 | 0.000 | ||
| 1 spectrum, FNEDFK | 0.028 | 0.000 | 0.000 | 0.000 | 0.000 | 0.972 | 0.000 | 0.000 | ||
| 1 spectrum, EHQETLDMDNPR | 0.000 | 0.075 | 0.000 | 0.000 | 0.000 | 0.554 | 0.371 | 0.000 | ||
| 1 spectrum, SYILR | 0.300 | 0.000 | 0.157 | 0.121 | 0.368 | 0.000 | 0.054 | 0.000 |
| Plot | Lyso | Other | |||||||||||
| Expt C |
2 peptides |
6 spectra |
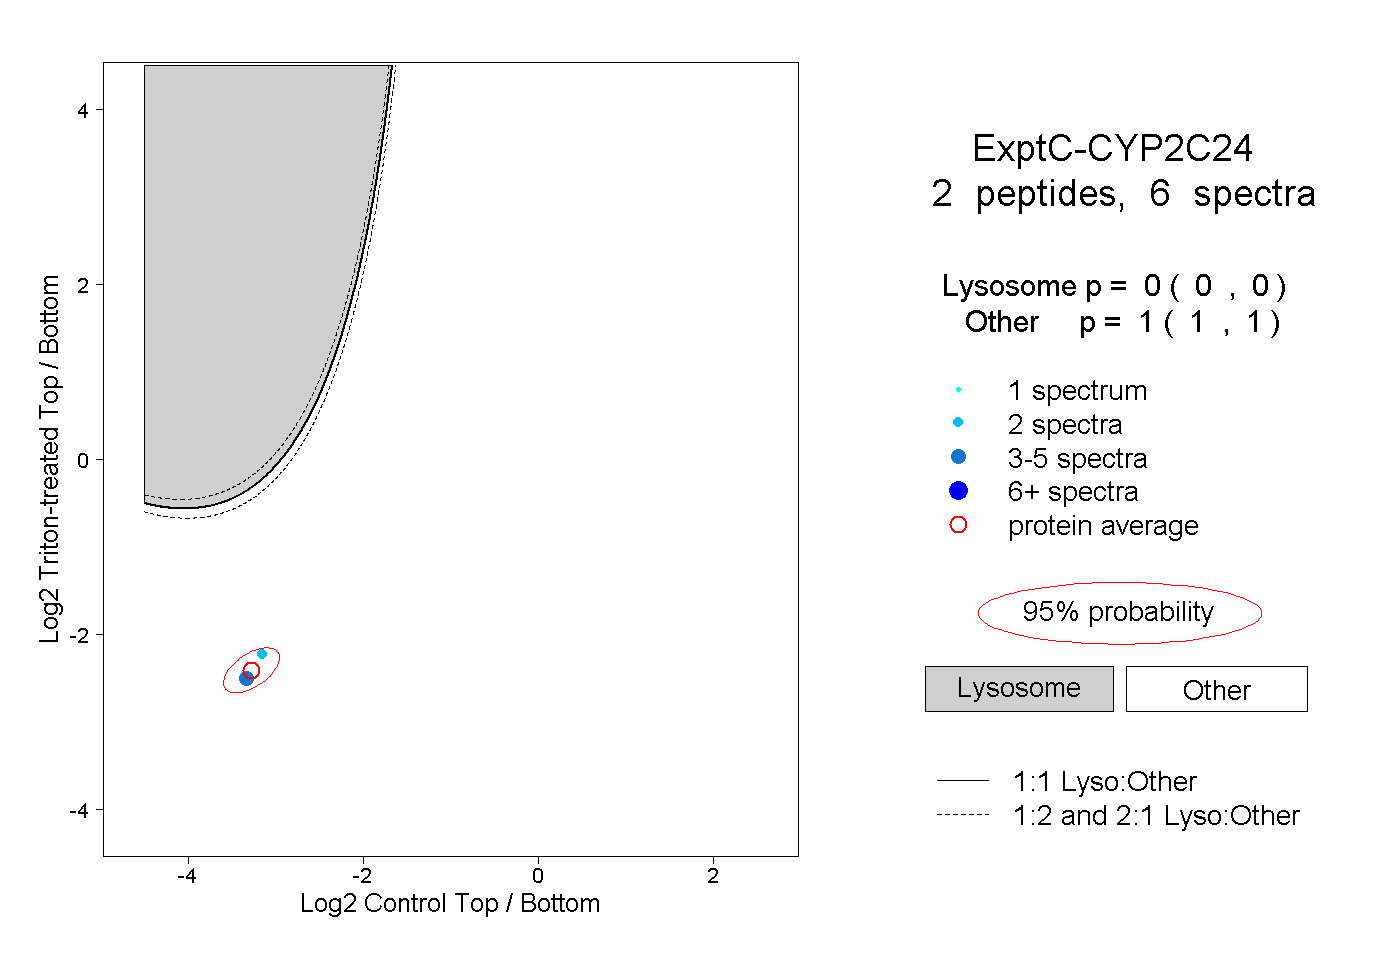 |
0.000 0.000 | 0.000 |
1.000 1.000 | 1.000 |
||||||||
| Plot | Lyso | Other | |||||||||||
| Expt D |
1 peptide |
1 spectrum |
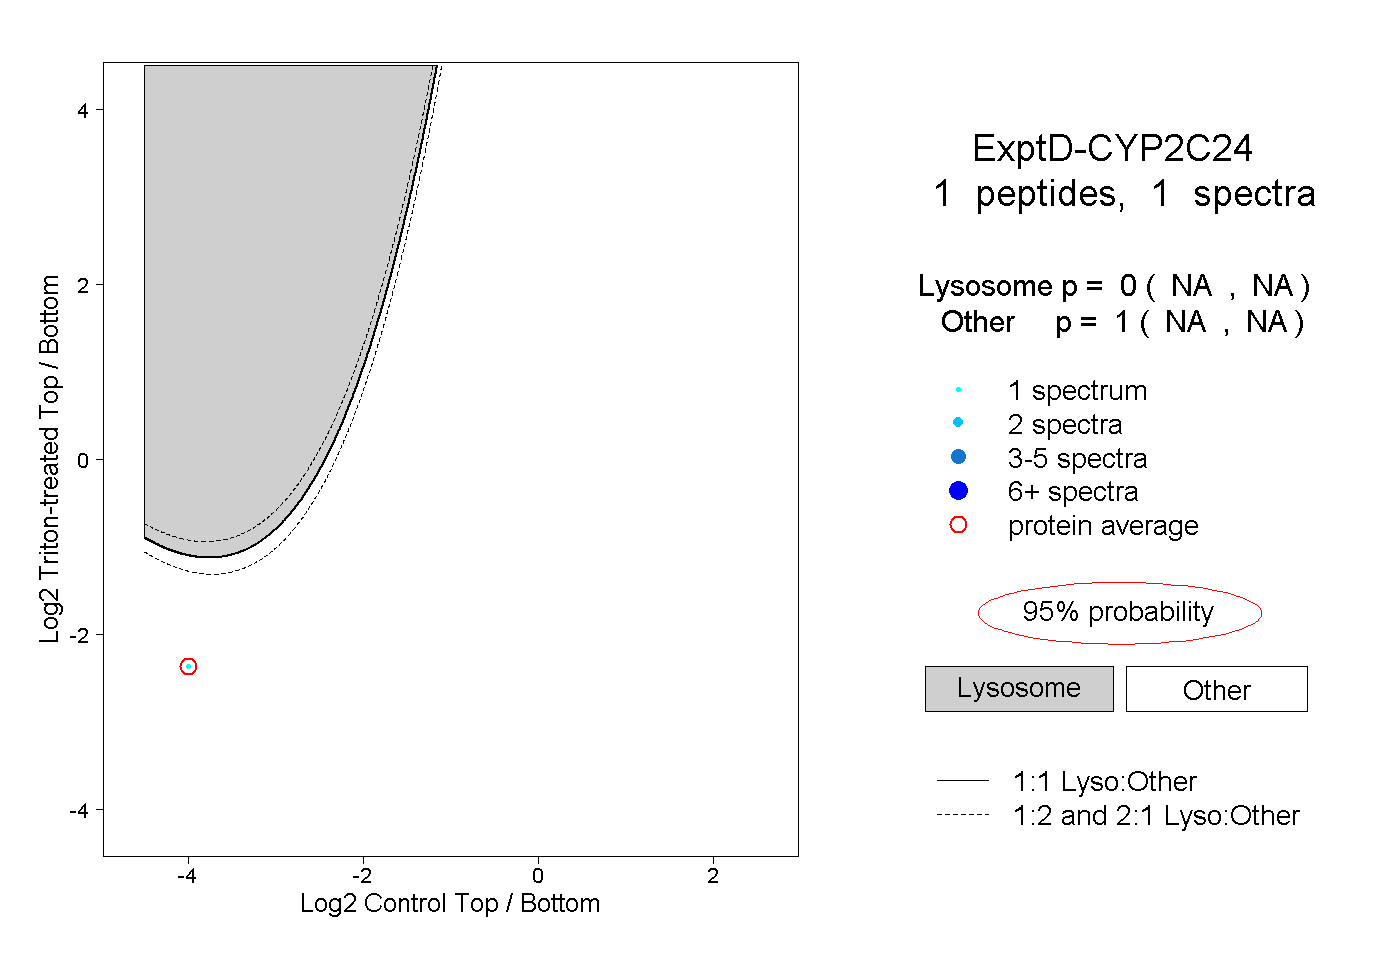 |
0.000 NA | NA |
1.000 NA | NA |