 4
4peptides
spectra
0.000 | 0.000
0.174 | 0.240
0.000 | 0.000
0.000 | 0.000
0.227 | 0.286
0.000 | 0.000
0.500 | 0.554
0.000 | 0.000
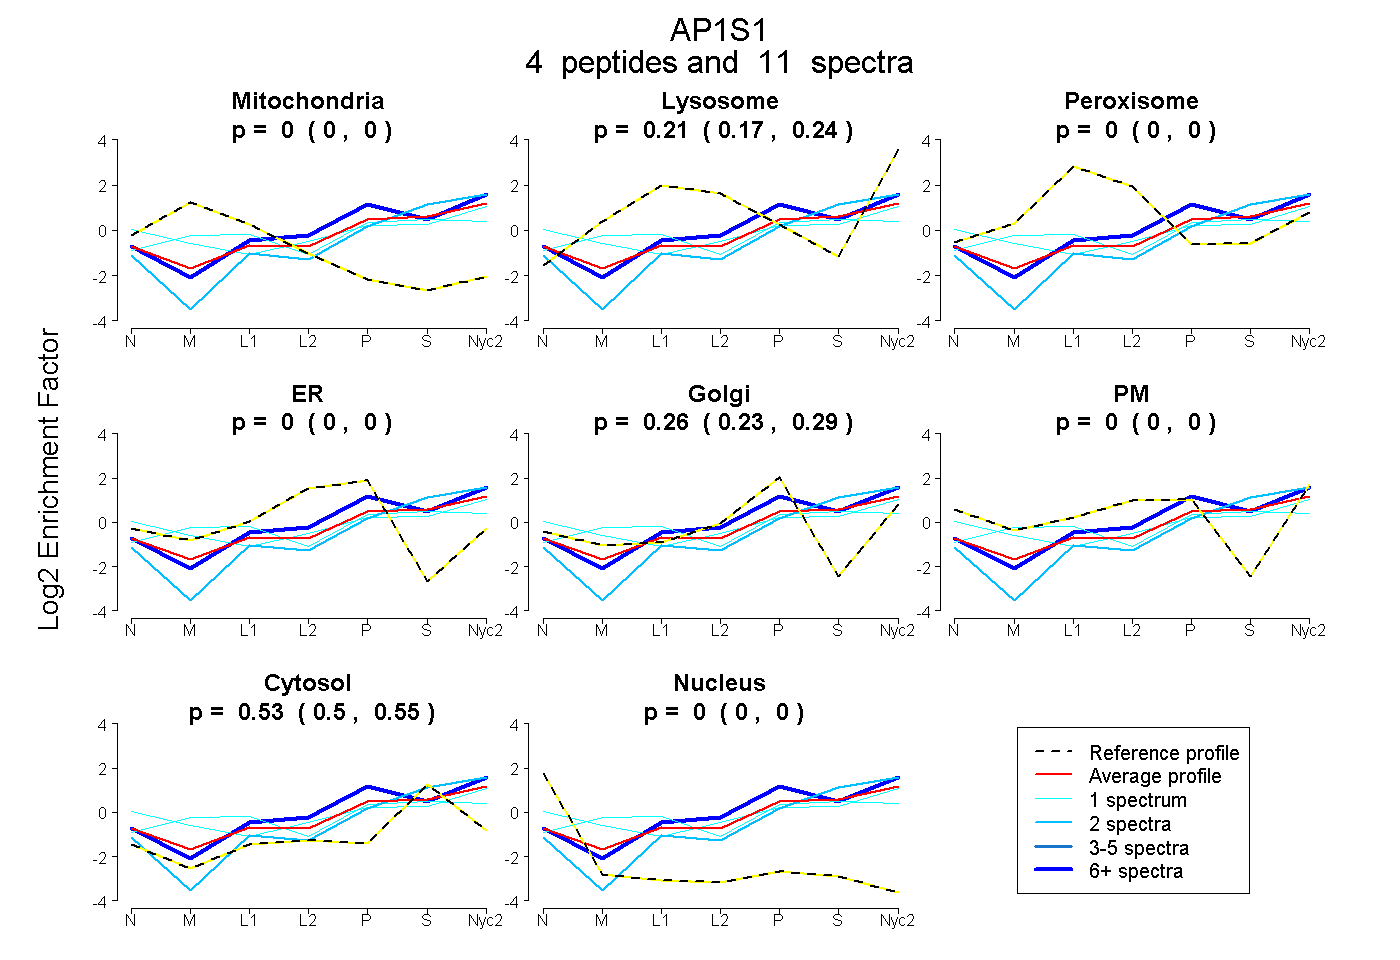
| Plot | Mito | Lyso | Perox | ER | Golgi | PM | Cytosol | Nucleus | |||||
| Expt A |
4 peptides |
11 spectra |
|
0.000 0.000 | 0.000 |
0.210 0.174 | 0.240 |
0.000 0.000 | 0.000 |
0.000 0.000 | 0.000 |
0.260 0.227 | 0.286 |
0.000 0.000 | 0.000 |
0.530 0.500 | 0.554 |
0.000 0.000 | 0.000 |
| 2 spectra, YVELLDK | 0.000 | 0.131 | 0.000 | 0.000 | 0.145 | 0.000 | 0.724 | 0.000 | ||
| 1 spectrum, MCSFLEWR | 0.092 | 0.235 | 0.009 | 0.000 | 0.197 | 0.000 | 0.467 | 0.000 | ||
| 7 spectra, ELMQVVLAR | 0.000 | 0.244 | 0.000 | 0.000 | 0.336 | 0.000 | 0.420 | 0.000 | ||
| 1 spectrum, WYLATSDK | 0.000 | 0.045 | 0.000 | 0.000 | 0.000 | 0.472 | 0.483 | 0.000 |
| Plot | Mito | Lyso or Perox | ER | Golgi | PM | Cytosol | Nucleus | ||||||
| Expt B |
1 peptide |
2 spectra |
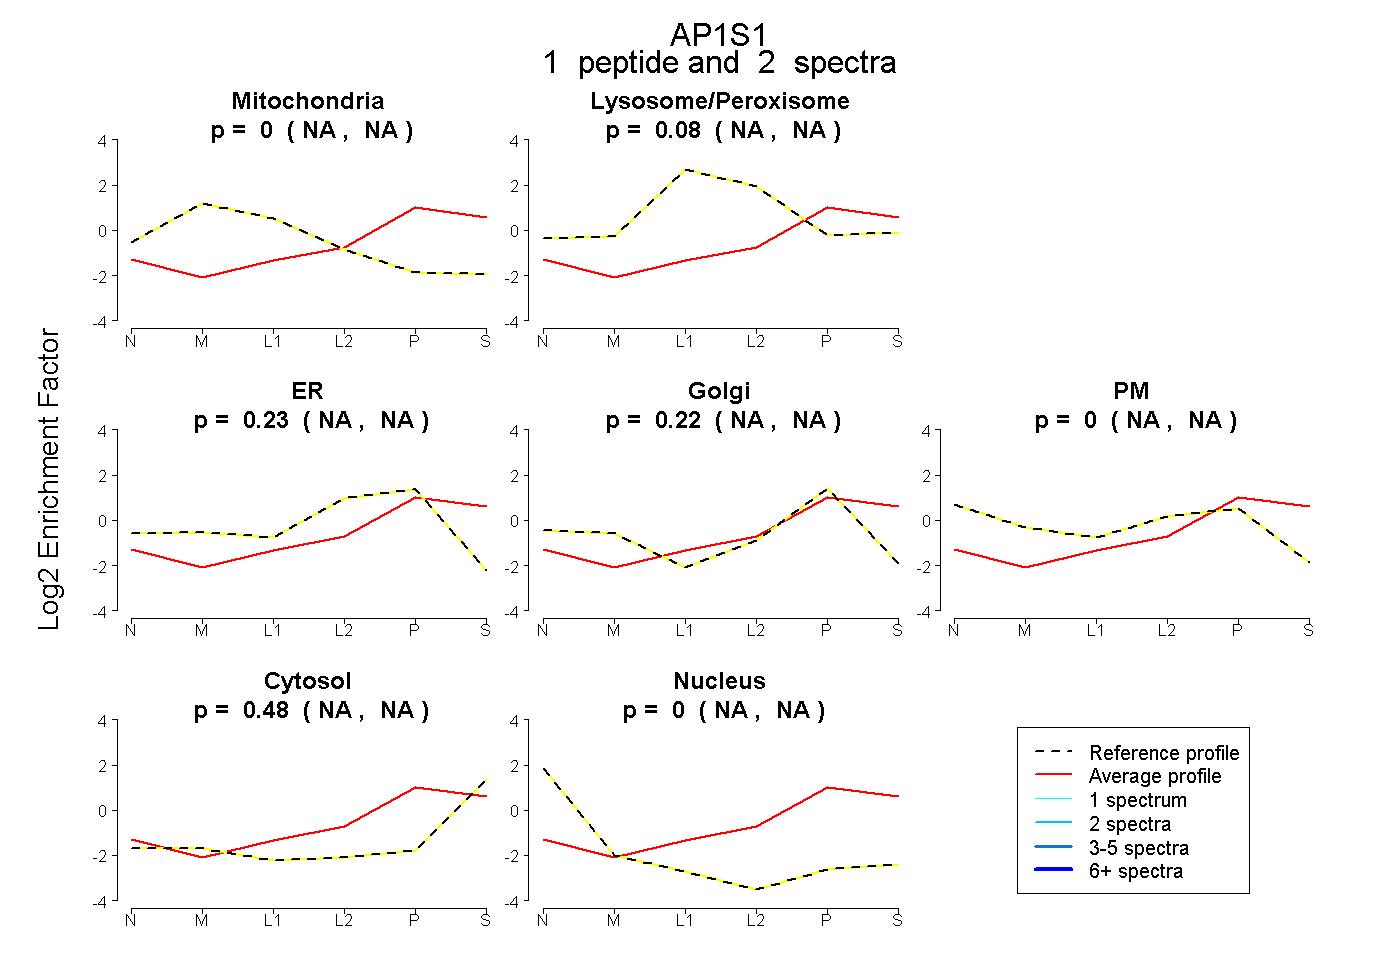 |
0.000 NA | NA |
0.077 NA | NA |
0.227 NA | NA |
0.215 NA | NA |
0.000 NA | NA |
0.481 NA | NA |
0.000 NA | NA |
|||
| Plot | Lyso | Other | |||||||||||
| Expt C |
3 peptides |
8 spectra |
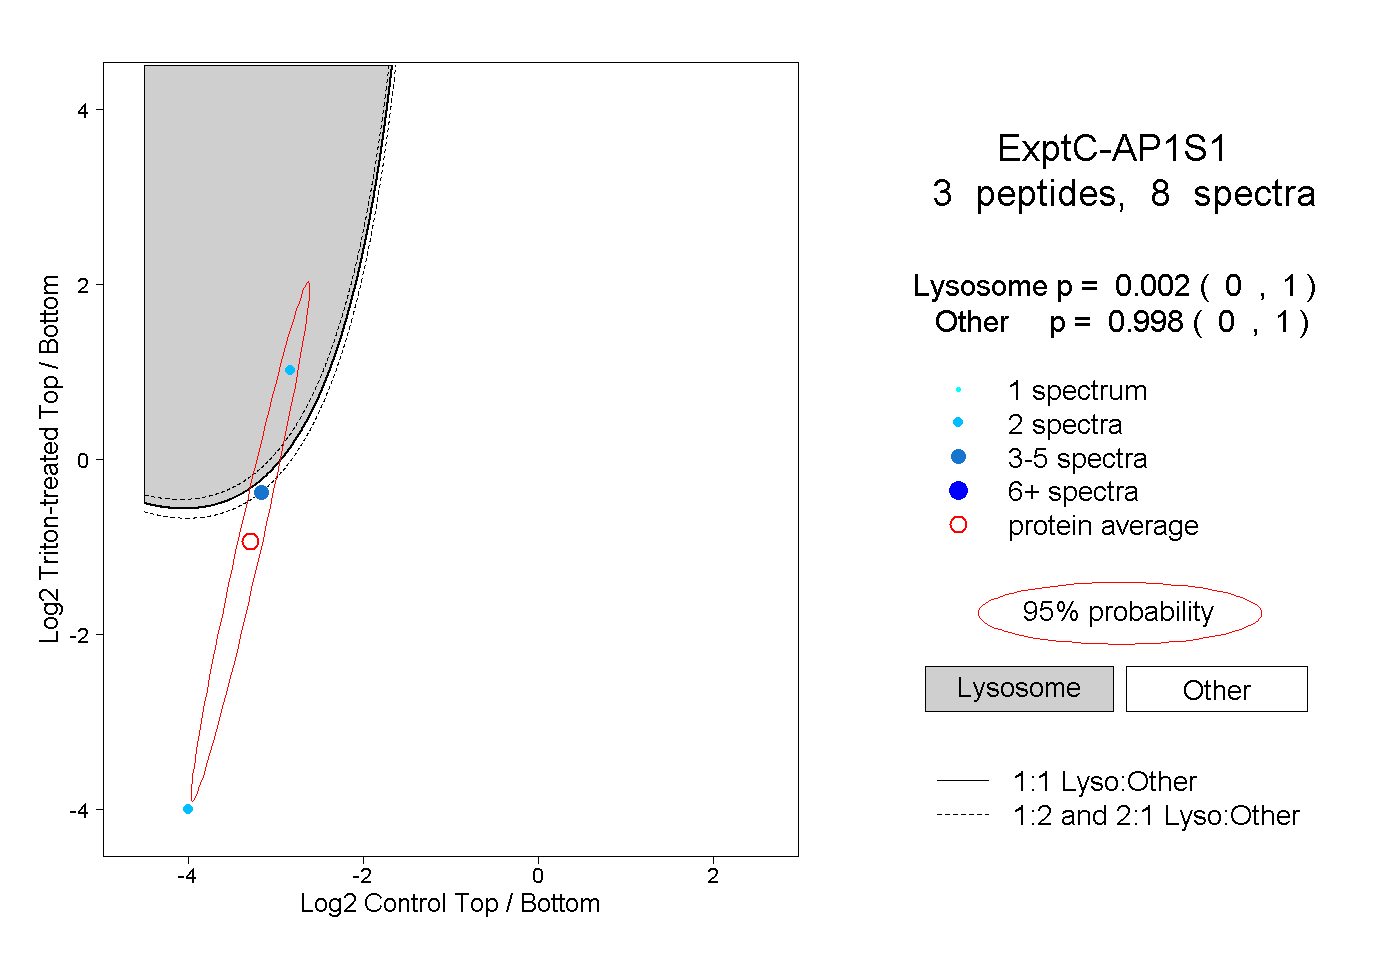 |
0.002 0.000 | 1.000 |
0.998 0.000 | 1.000 |