 4
4peptides
spectra
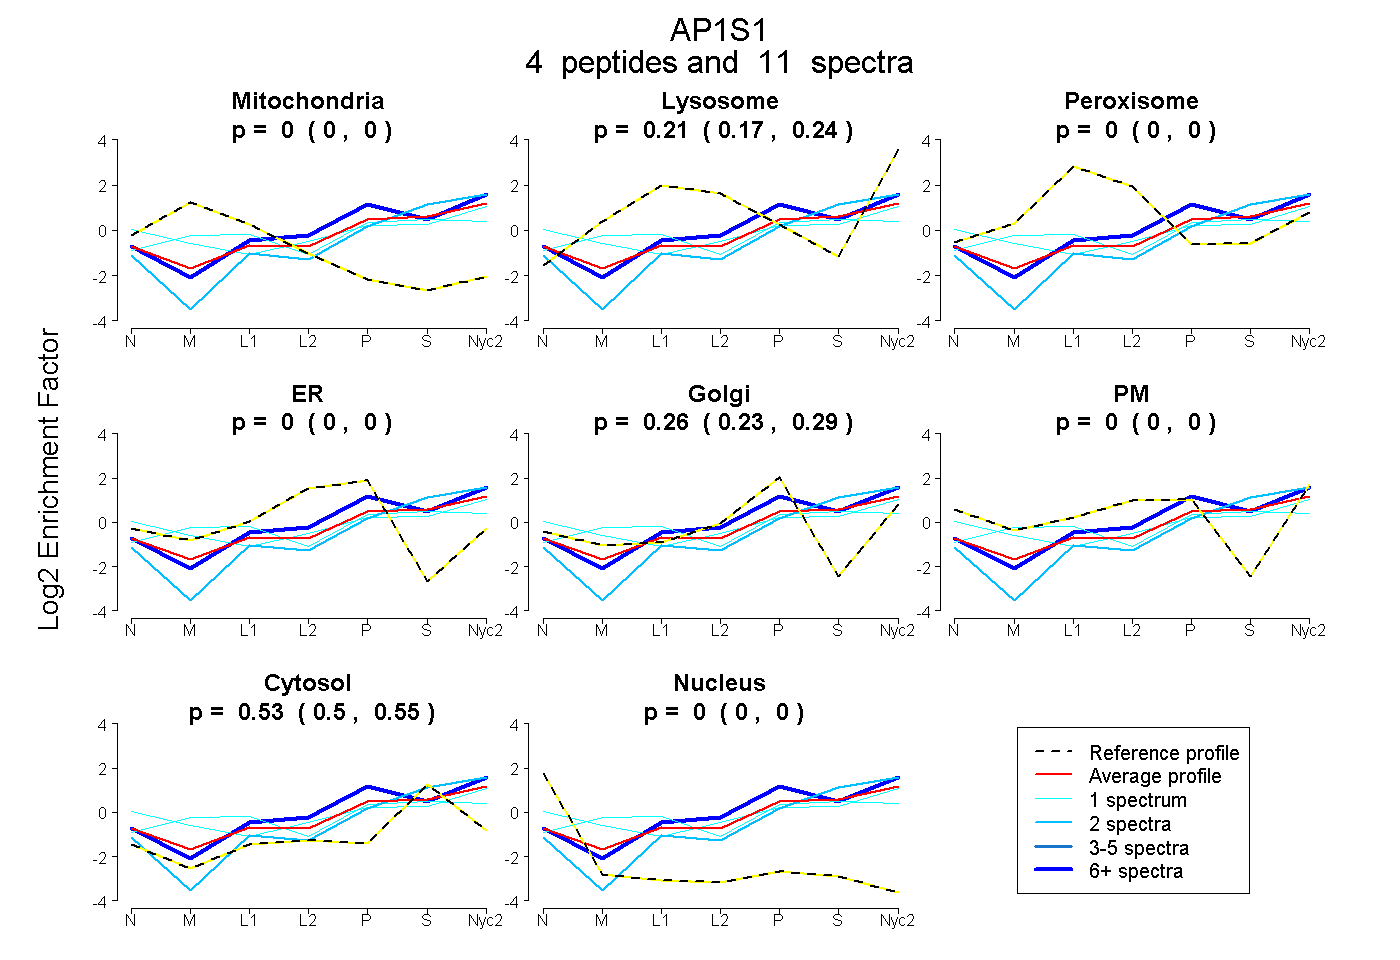
0.000 | 0.000
0.174 | 0.240
0.000 | 0.000
0.000 | 0.000
0.227 | 0.286
0.000 | 0.000
0.500 | 0.554
0.000 | 0.000
1peptide
spectra
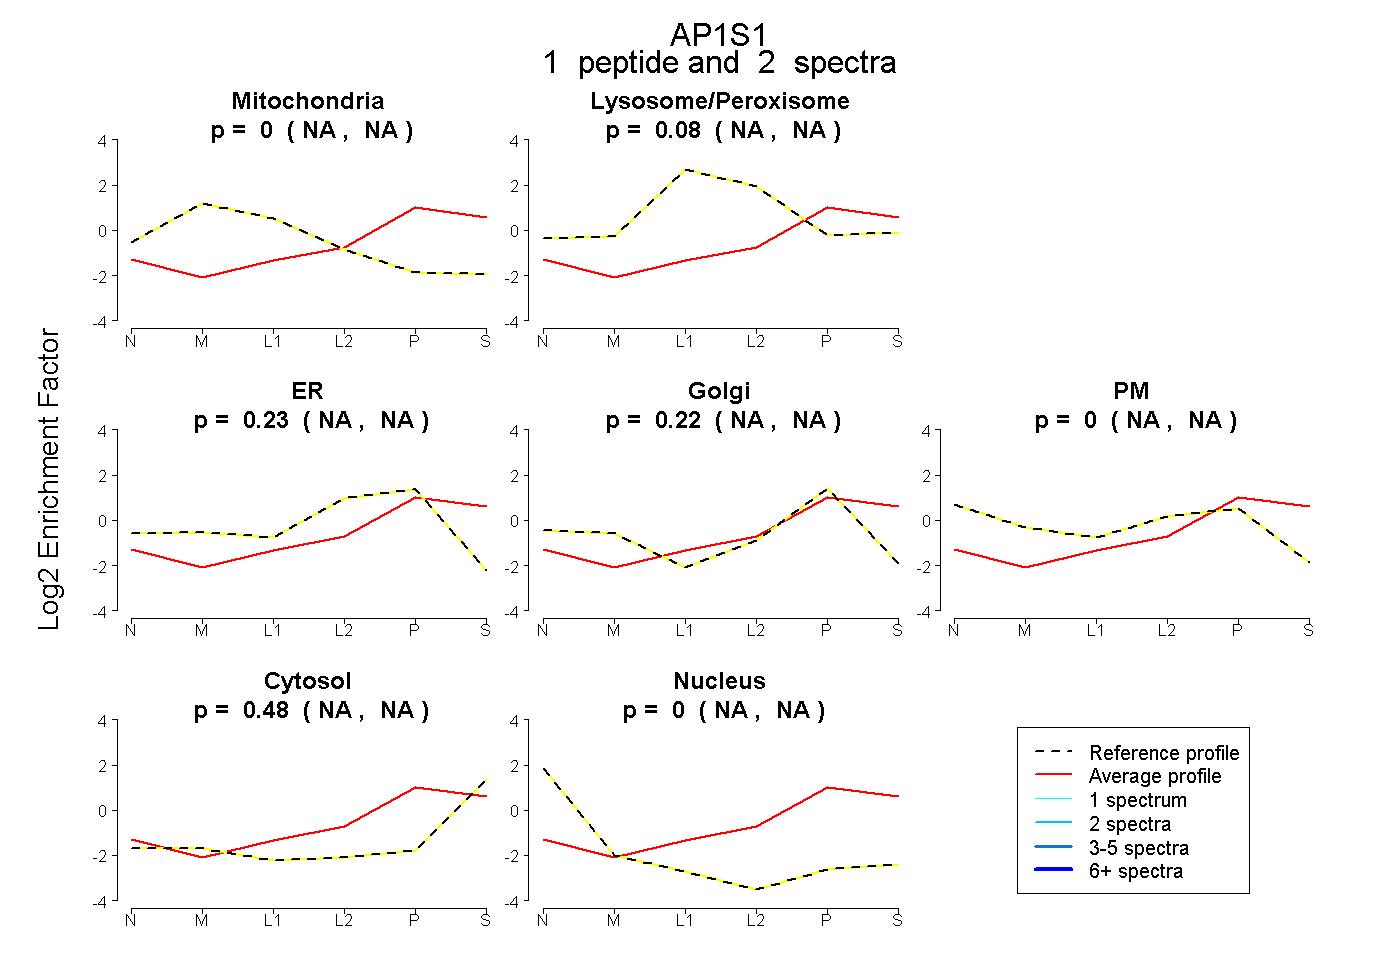
NA | NA
NA | NA
NA | NA
NA | NA
NA | NA
NA | NA
NA | NA
3peptides
spectra
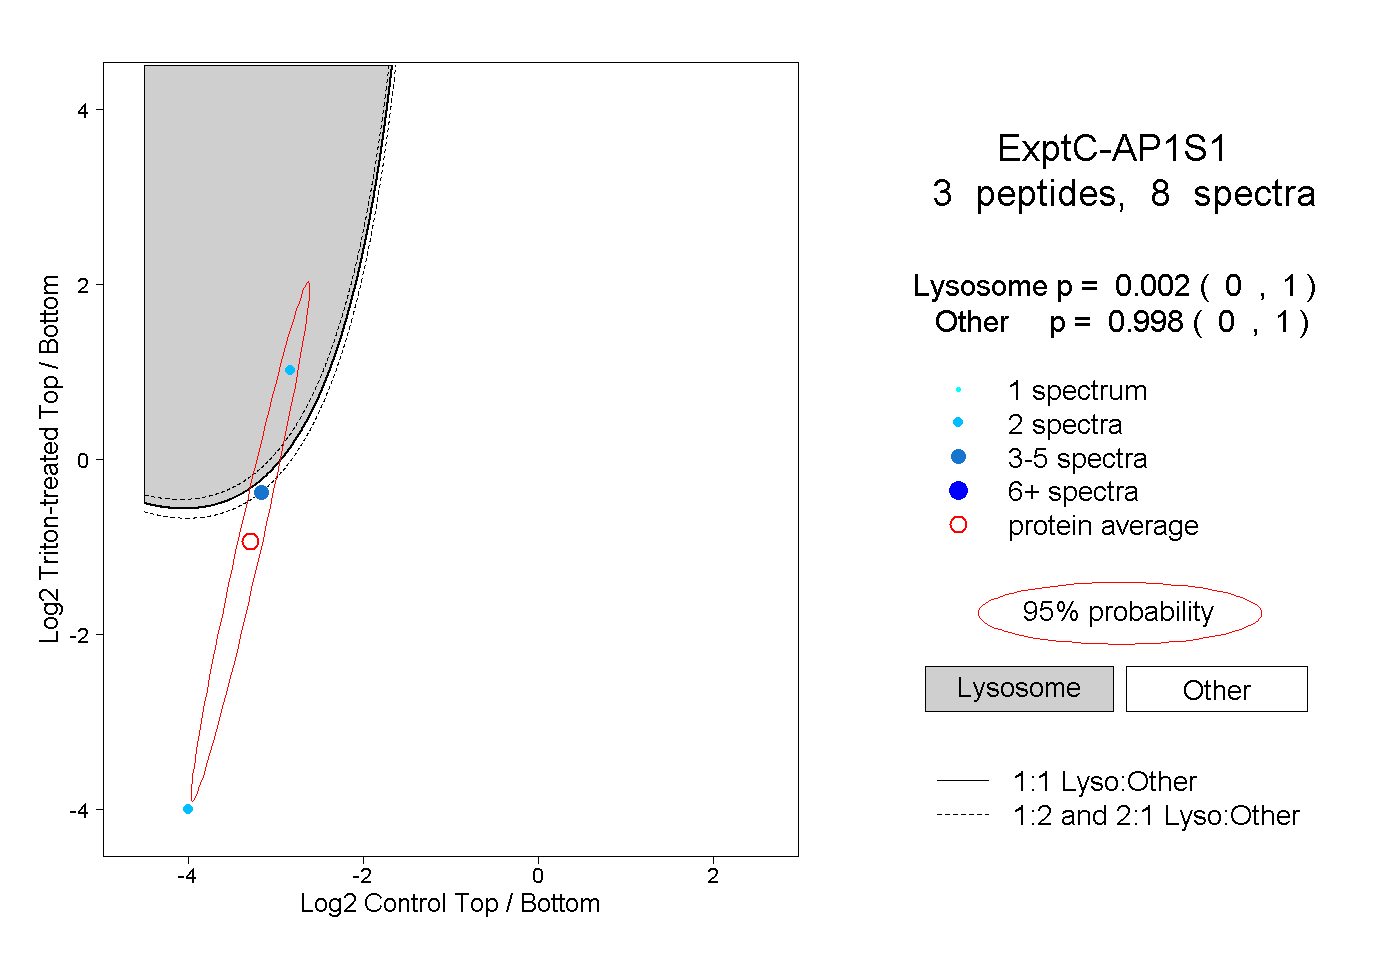
0.000 | 1.000
0.000 | 1.000