 8
8peptides
spectra
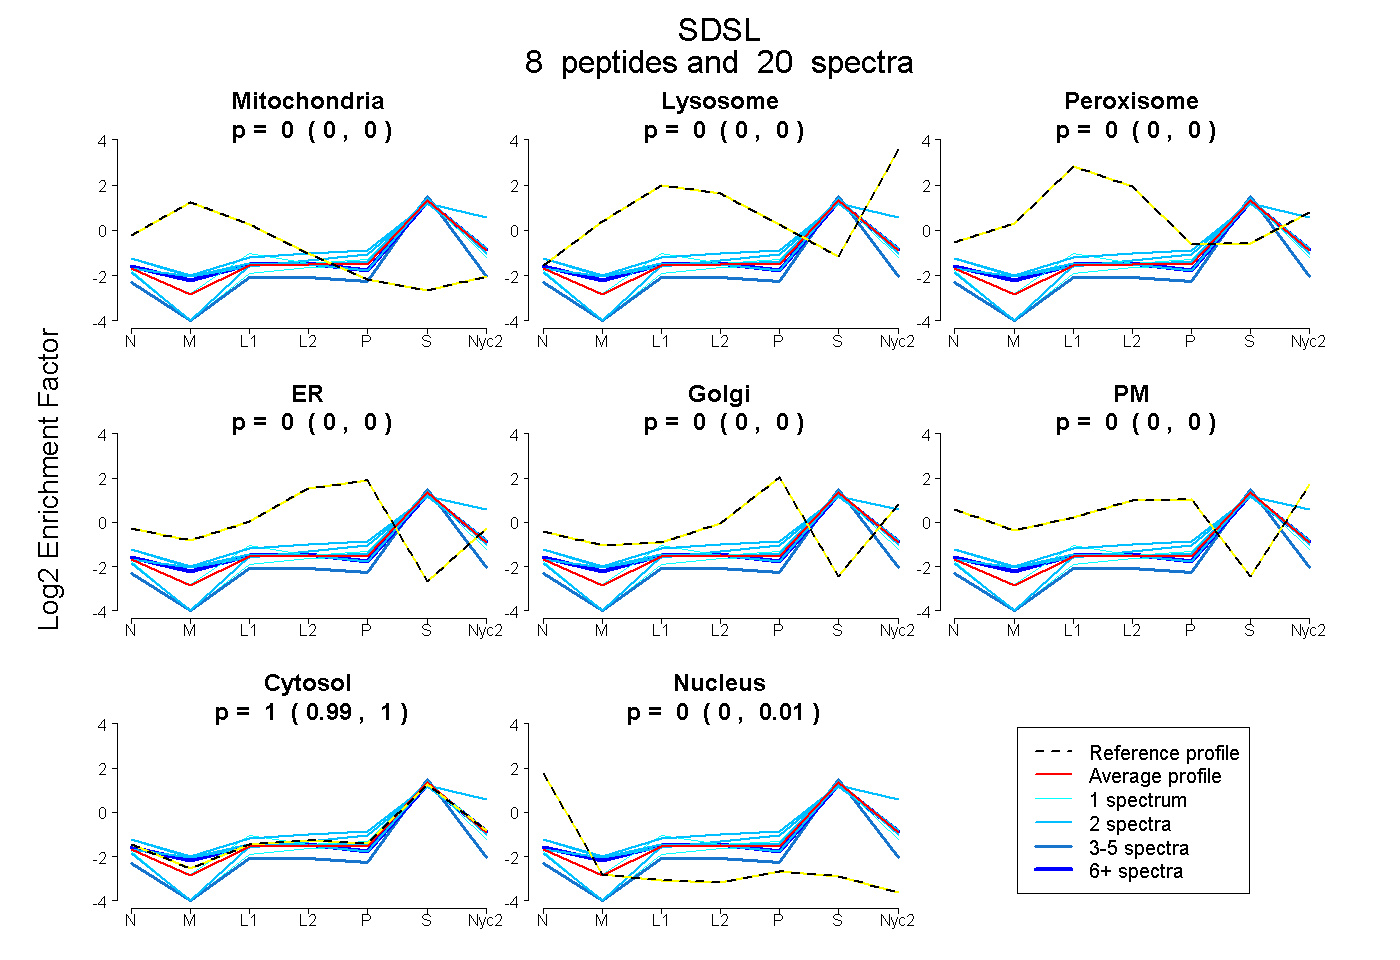
0.000 | 0.000
0.000 | 0.000
0.000 | 0.000
0.000 | 0.000
0.000 | 0.000
0.000 | 0.000
0.993 | 1.000
0.000 | 0.006
5peptides
spectra
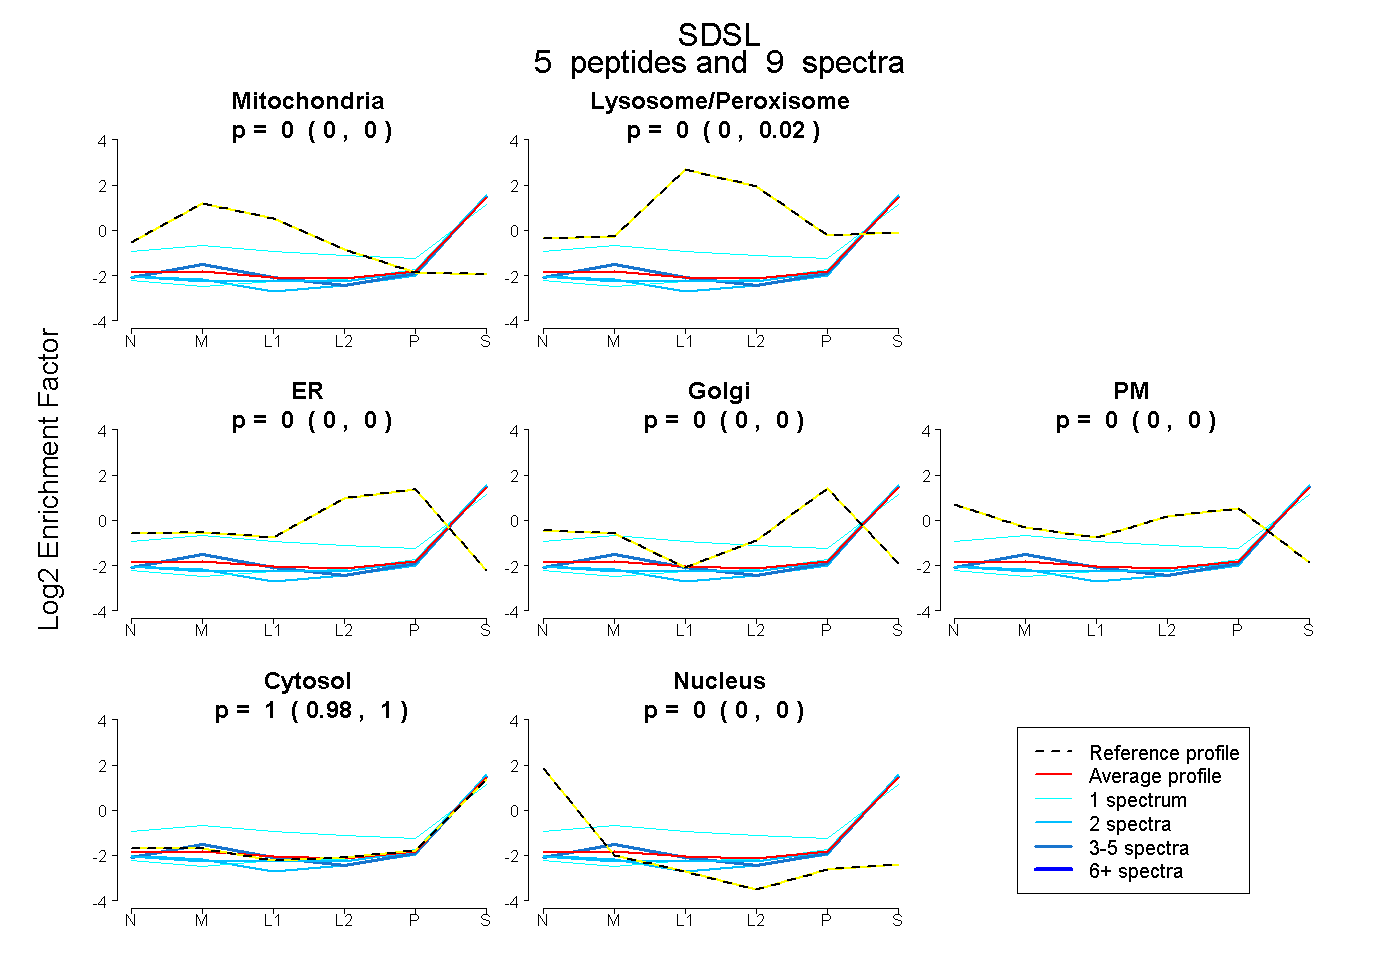
0.000 | 0.000
0.000 | 0.020
0.000 | 0.000
0.000 | 0.000
0.000 | 0.000
0.977 | 1.000
0.000 | 0.000
6peptides
spectra
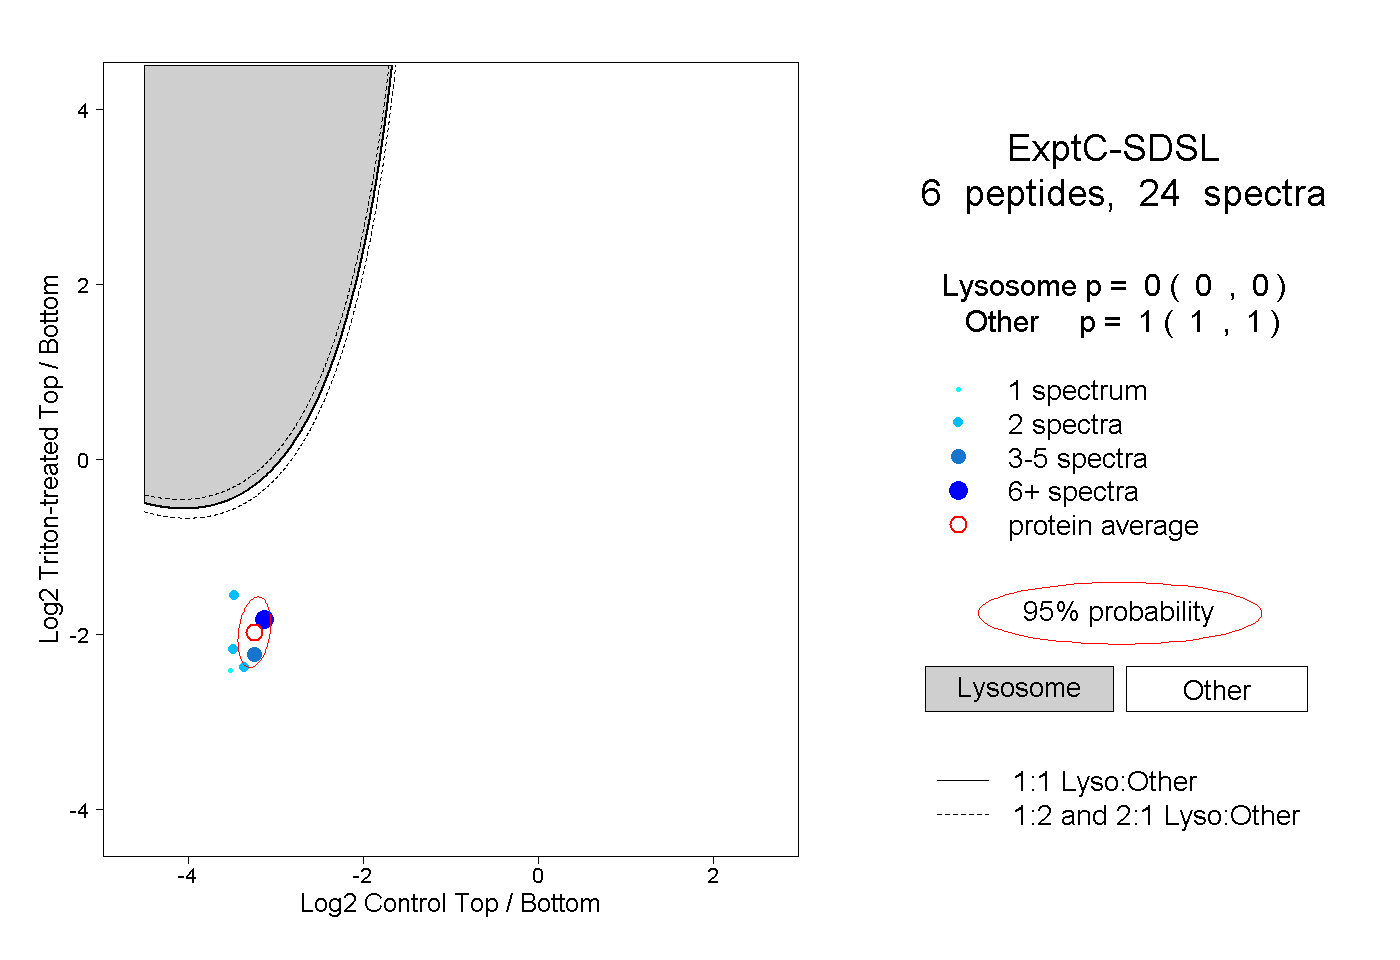
0.000 | 0.000
1.000 | 1.000
2peptides
spectra
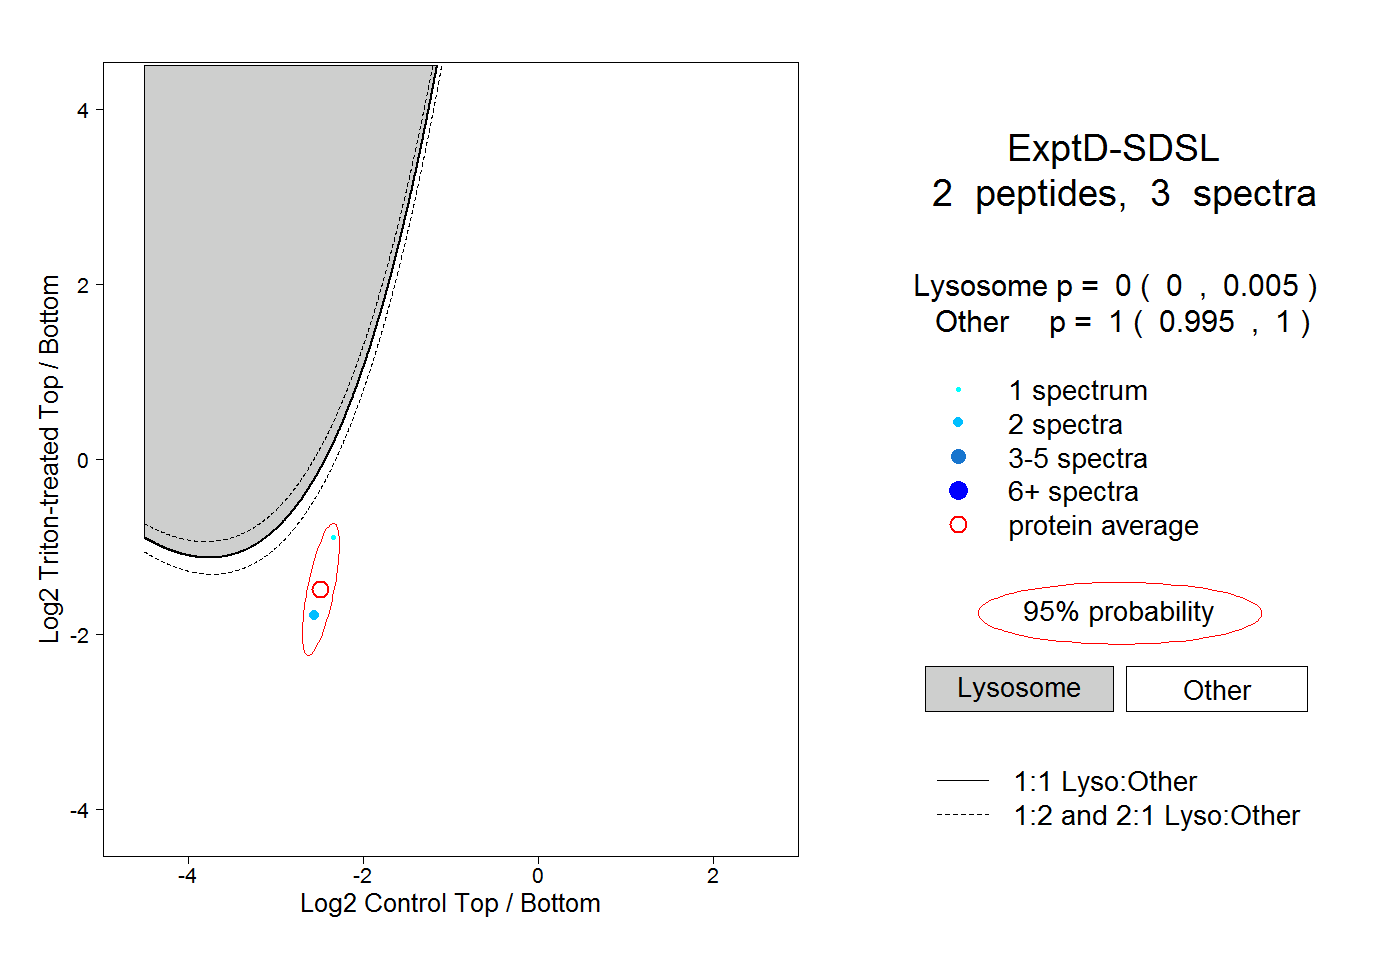
0.000 | 0.005
0.995 | 1.000