SDSL
[ENSRNOP00000001882]
Main page
| | | Plot |
Mito |
Lyso |
|
Perox |
ER |
Golgi |
PM |
Cytosol |
Nucleus |
|
| Expt A |
 8
8
peptides |
20
spectra |
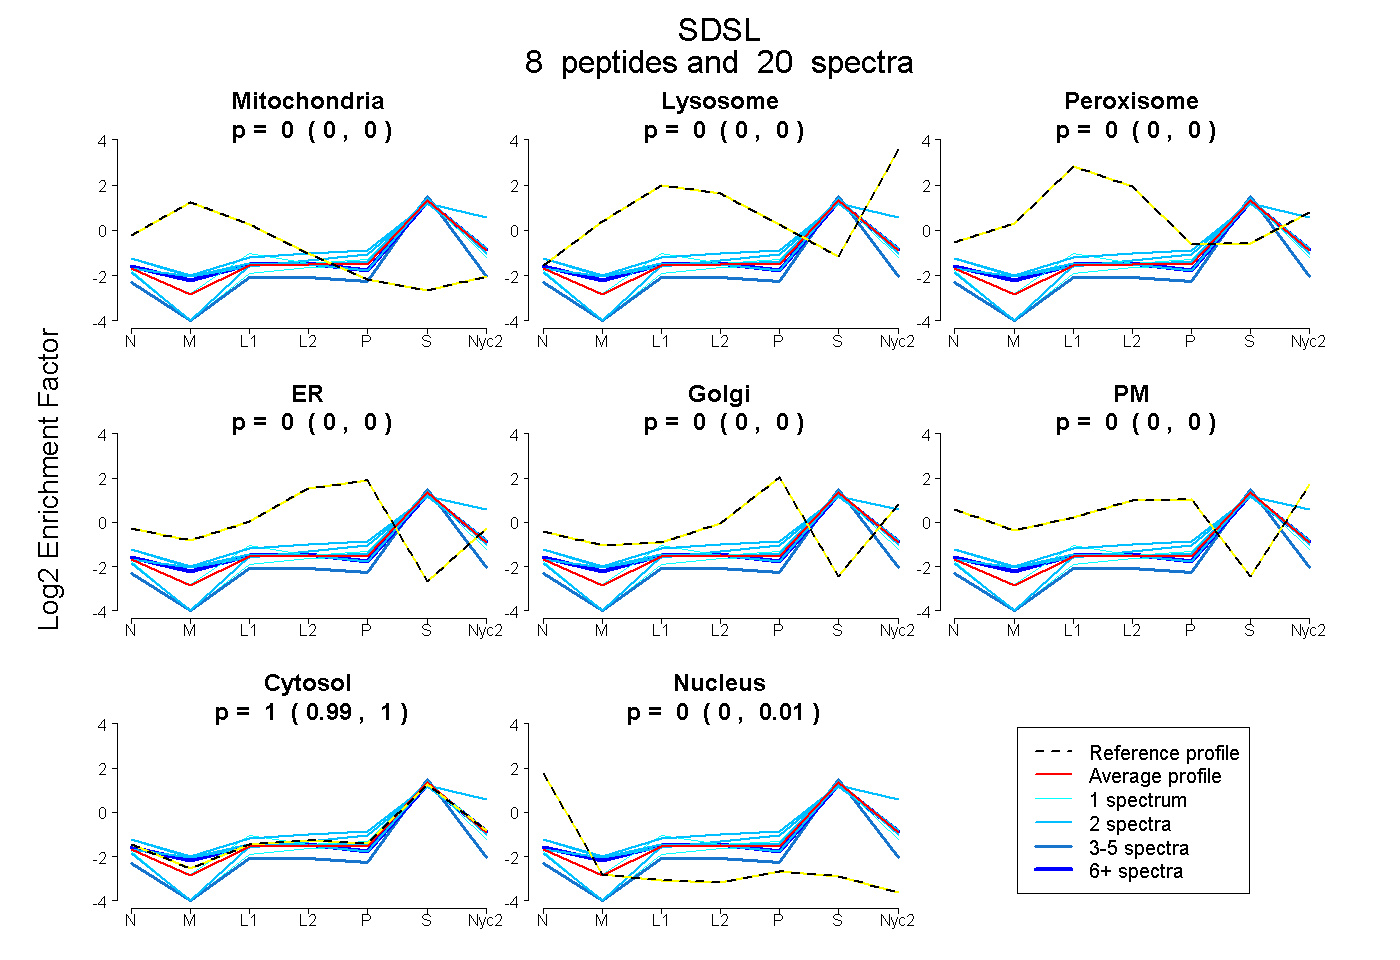 |
0.000
0.000 | 0.000 |
0.000
0.000 | 0.000 |
|
0.000
0.000 | 0.000 |
0.000
0.000 | 0.000 |
0.000
0.000 | 0.000 |
0.000
0.000 | 0.000 |
1.000
0.993 | 1.000 |
0.000
0.000 | 0.006 |
|
| | | Plot |
Mito |
|
Lyso or Perox |
|
ER |
Golgi |
PM |
Cytosol |
Nucleus |
|
| Expt B |
5
peptides |
9
spectra |
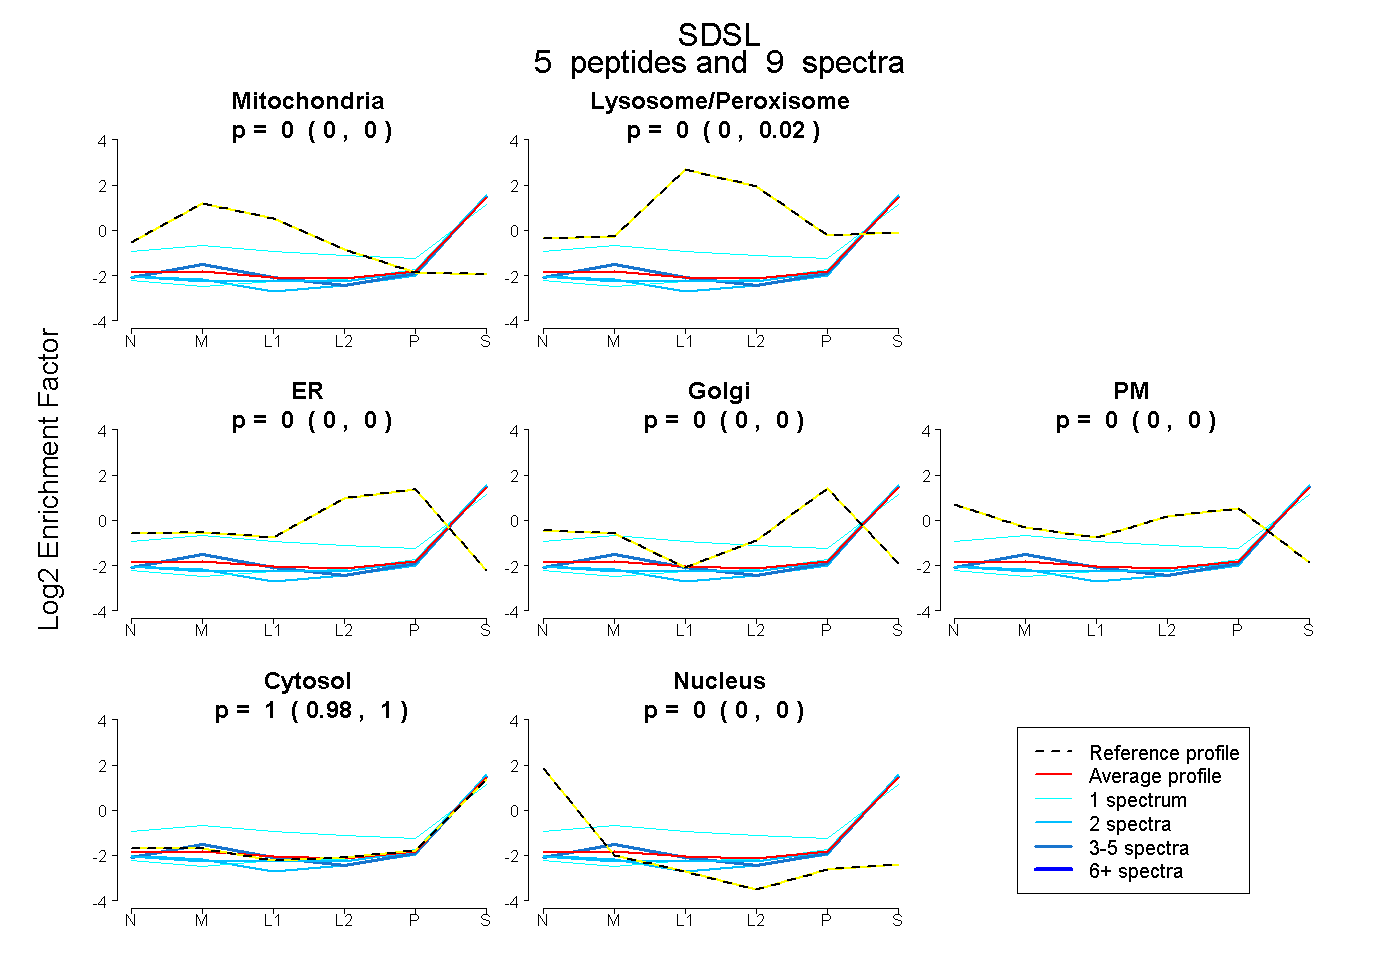 |
0.000
0.000 | 0.000 |
|
0.000
0.000 | 0.020 |
|
0.000
0.000 | 0.000 |
0.000
0.000 | 0.000 |
0.000
0.000 | 0.000 |
1.000
0.977 | 1.000 |
0.000
0.000 | 0.000 |
|
| | | Plot |
|
Lyso |
|
|
|
|
|
|
|
Other |
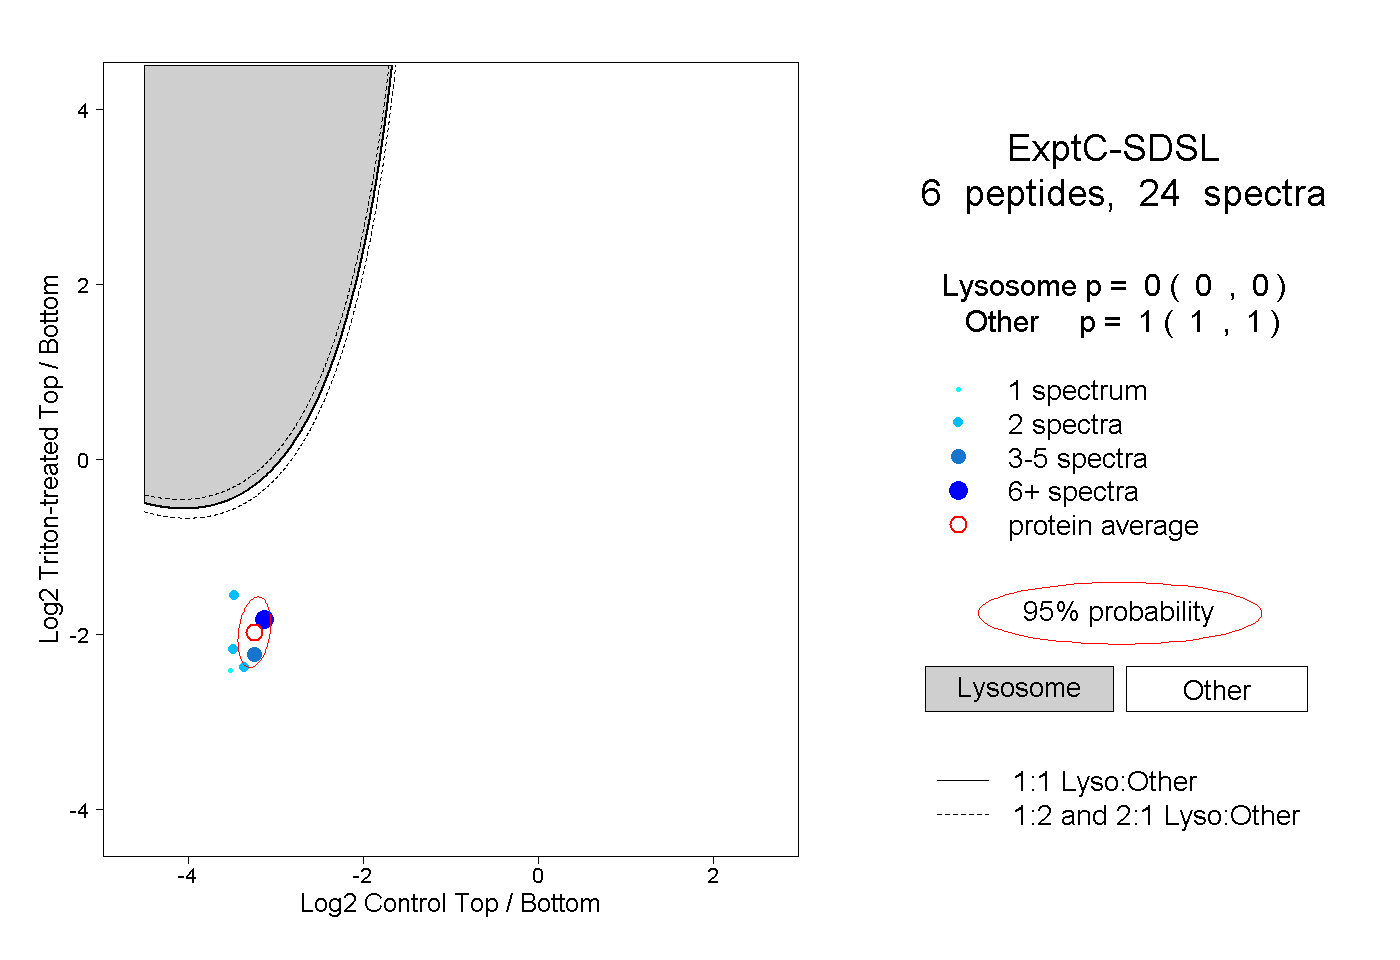
| Expt C |
6
peptides |
24
spectra |
 |
|
0.000
0.000 | 0.000 |
|
|
|
|
|
|
|
1.000
1.000 | 1.000 |
| 4 spectra, AEPFHR |
|
0.000 |
|
|
|
|
|
|
|
1.000 |
| 13 spectra, FLDDER |
|
0.000 |
|
|
|
|
|
|
|
1.000 |
| 2 spectra, LVTLPDITSVAR |
|
0.000 |
|
|
|
|
|
|
|
1.000 |
| 2 spectra, VWDEANVR |
|
0.000 |
|
|
|
|
|
|
|
1.000 |
| 1 spectrum, AQELATR |
|
0.000 |
|
|
|
|
|
|
|
1.000 |
| 2 spectra, GAHSFNAALLAGR |
|
0.000 |
|
|
|
|
|
|
|
1.000 |
| | | Plot |
|
Lyso |
|
|
|
|
|
|
|
Other |
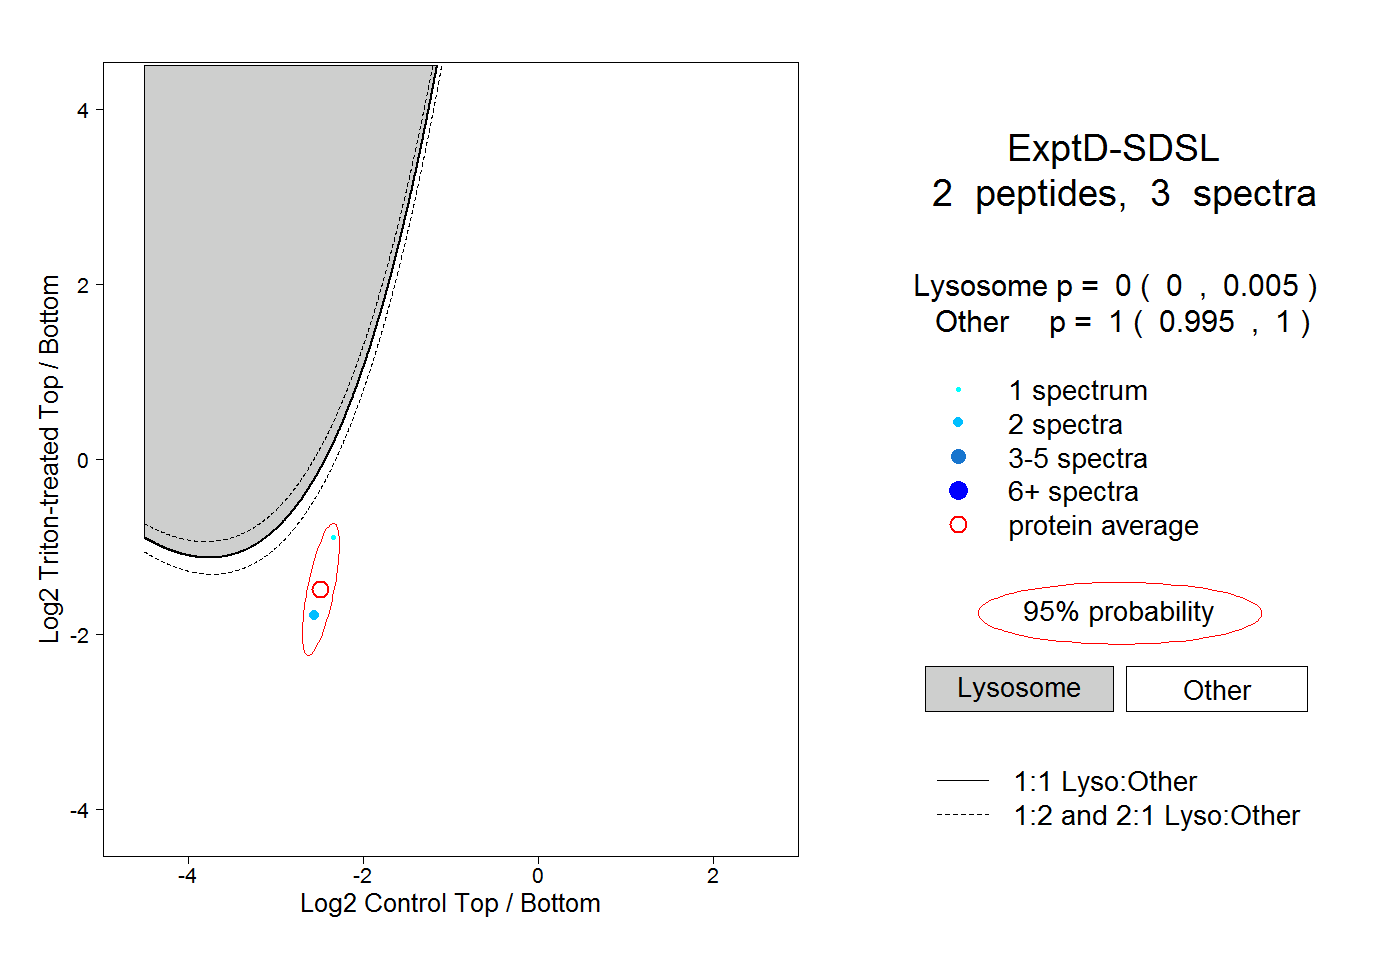
| Expt D |
2
peptides |
3
spectra |
 |
|
0.000
0.000 | 0.005 |
|
|
|
|
|
|
|
1.000
0.995 | 1.000 |