 5
5peptides
spectra
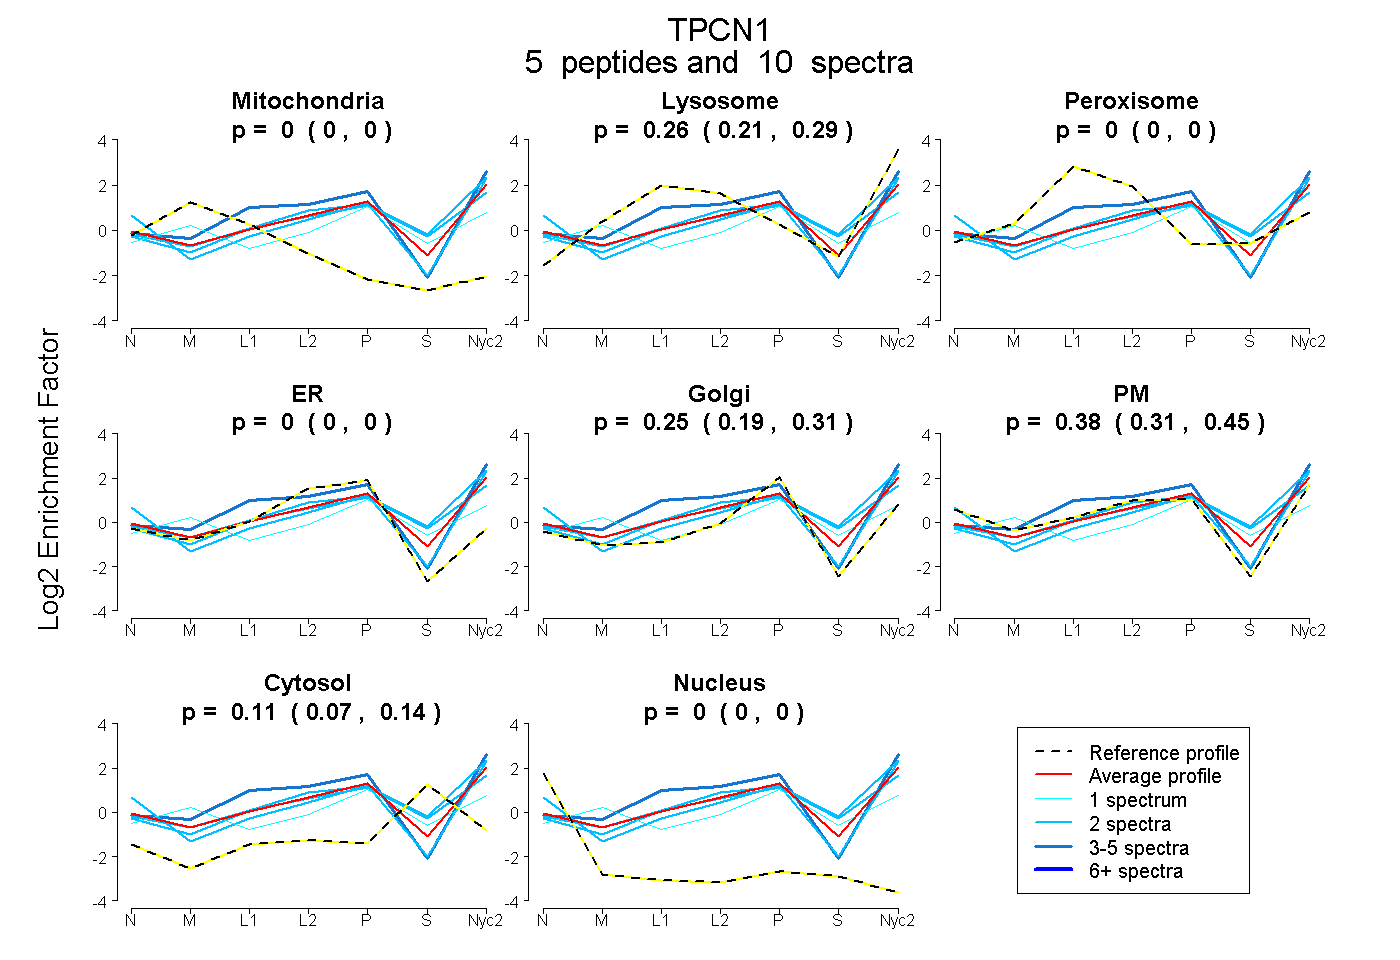
0.000 | 0.000
0.209 | 0.294
0.000 | 0.000
0.000 | 0.000
0.189 | 0.306
0.307 | 0.451
0.073 | 0.135
0.000 | 0.000
1peptide
spectra
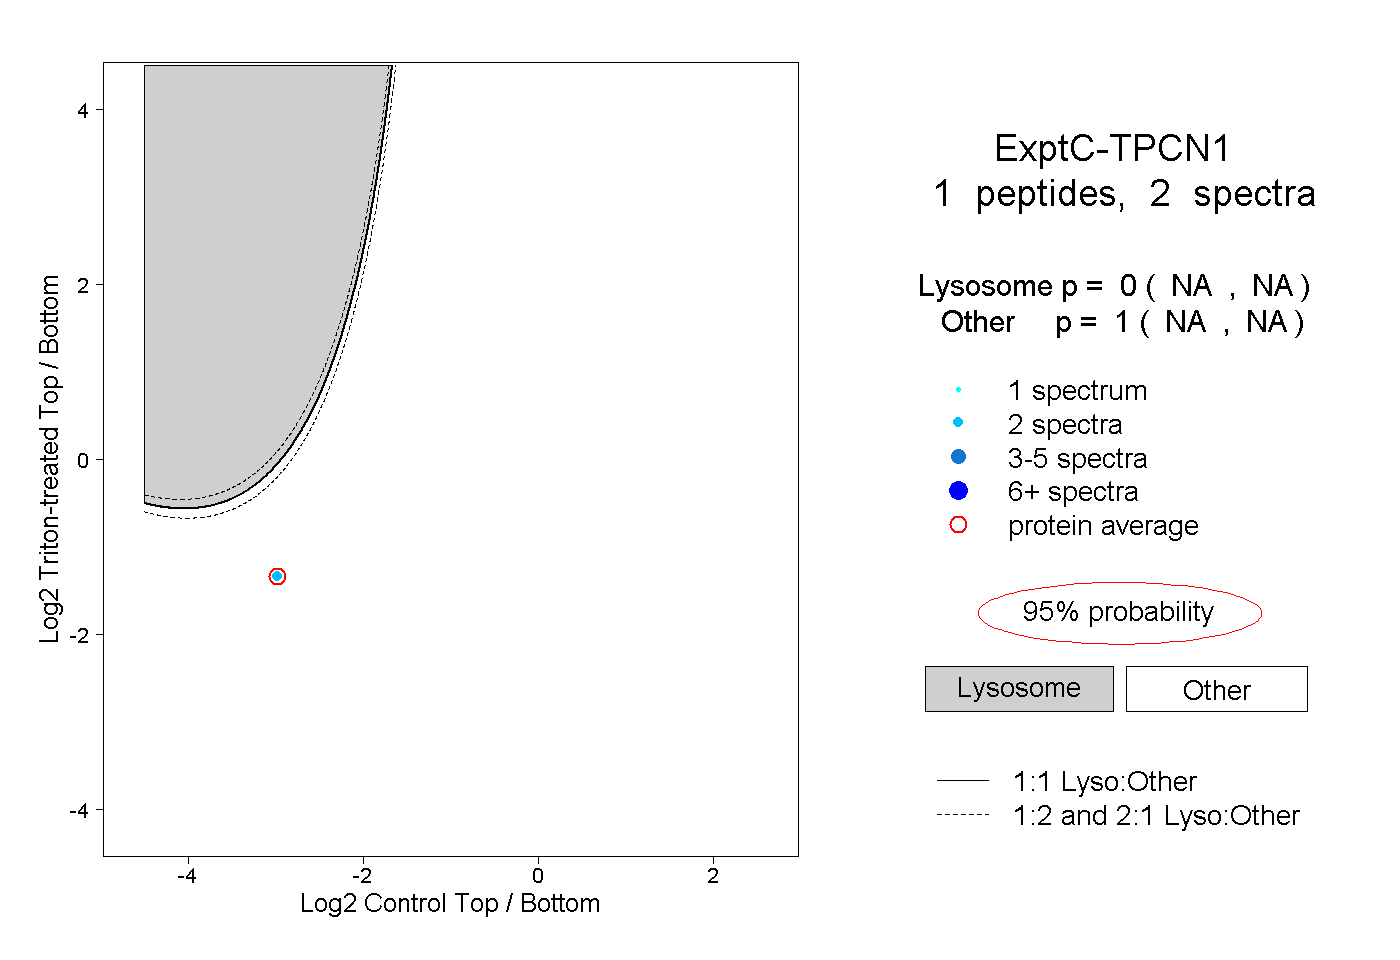
NA | NA
NA | NA
1peptide
spectrum
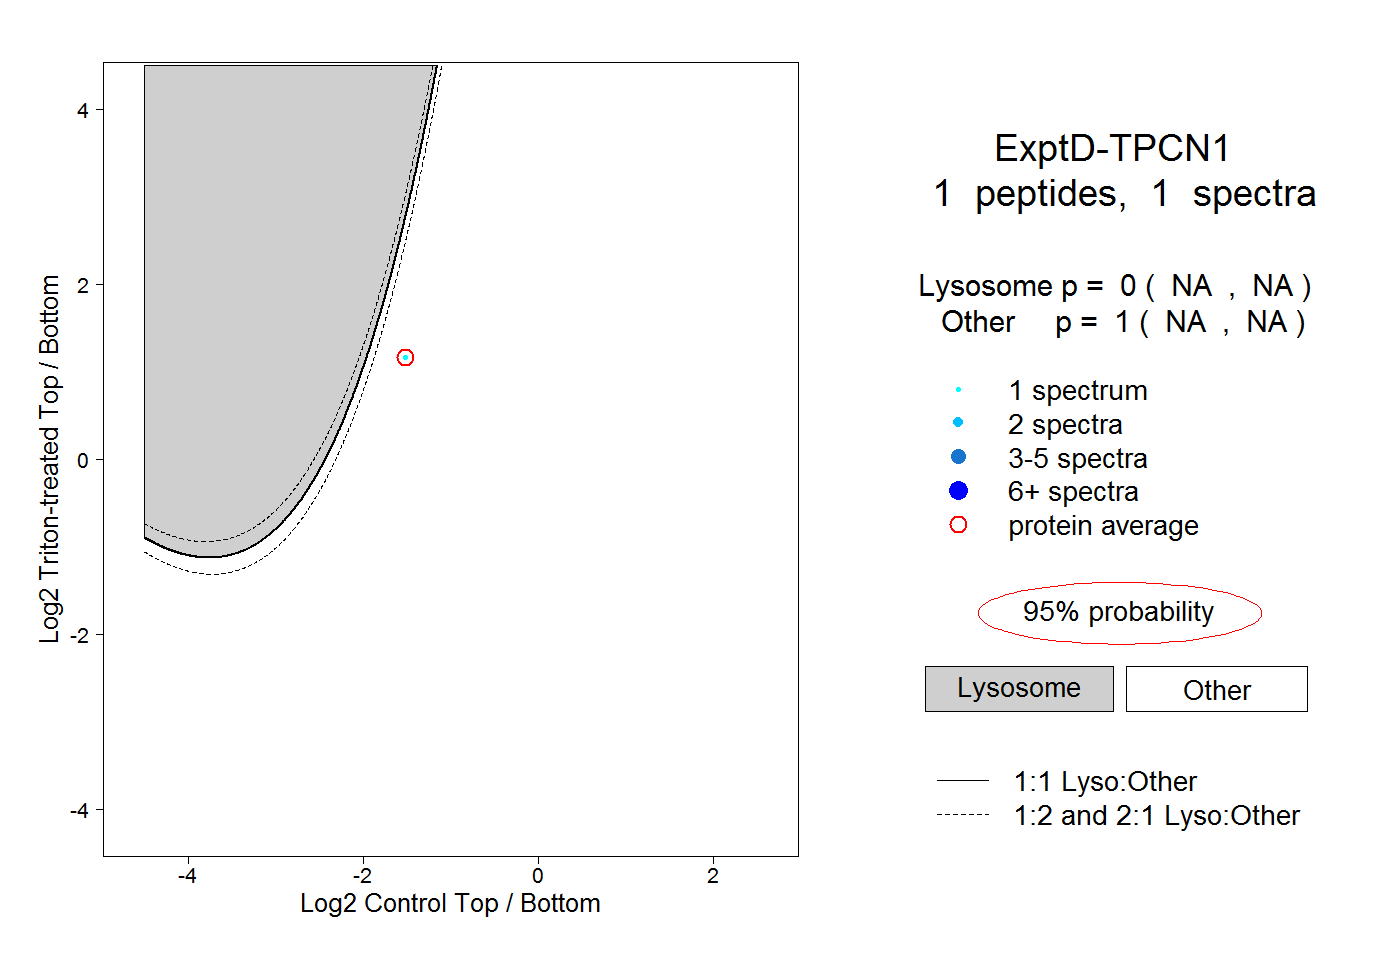
NA | NA
NA | NA