 5
5peptides
spectra
0.000 | 0.000
0.209 | 0.294
0.000 | 0.000
0.000 | 0.000
0.189 | 0.306
0.307 | 0.451
0.073 | 0.135
0.000 | 0.000
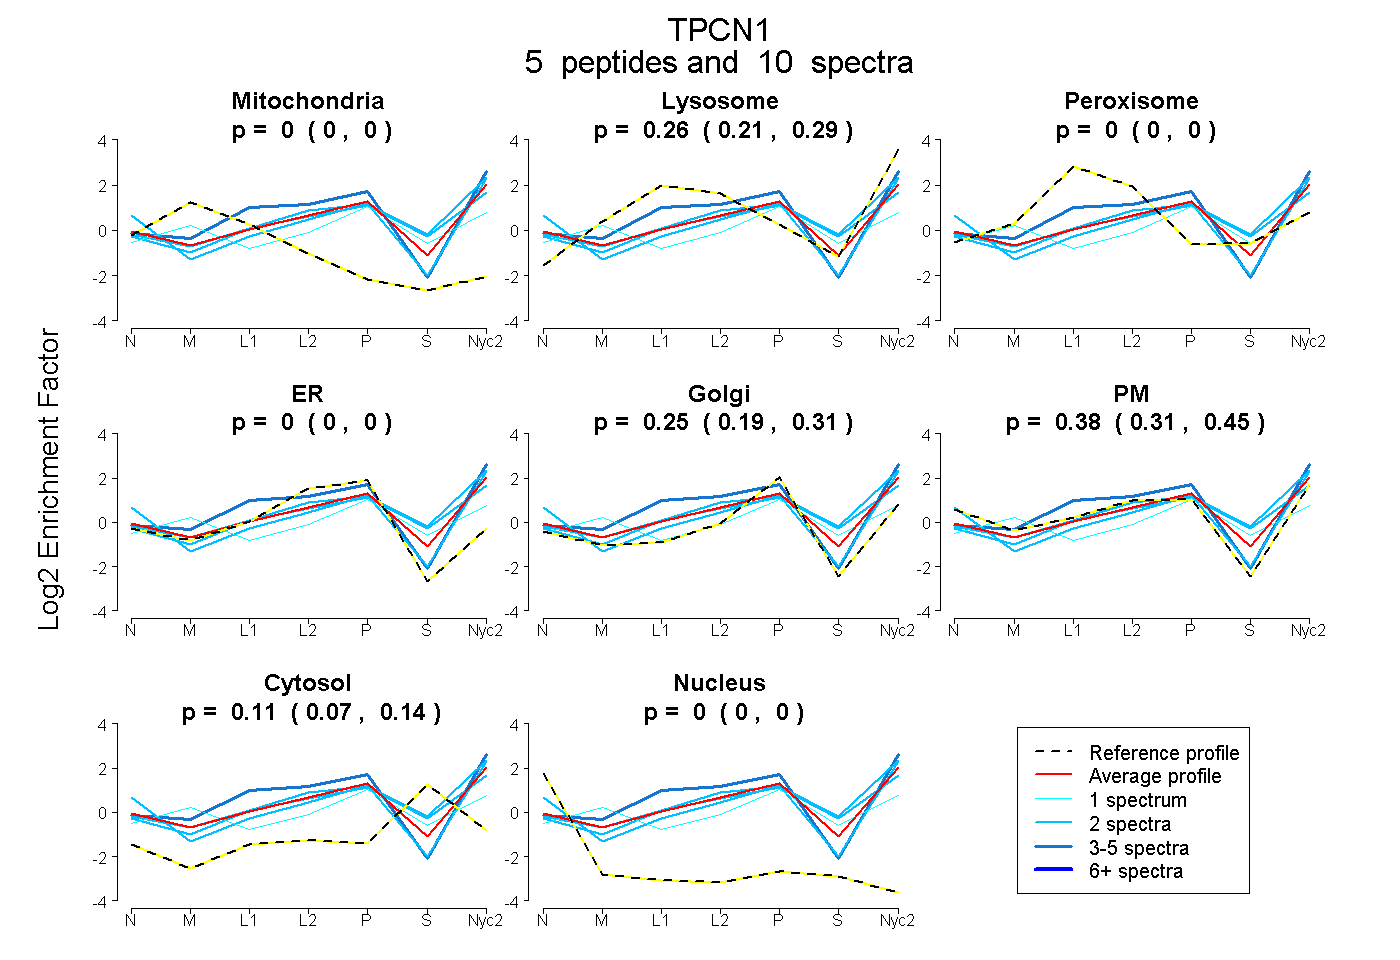
| Plot | Mito | Lyso | Perox | ER | Golgi | PM | Cytosol | Nucleus | |||||
| Expt A |
5 peptides |
10 spectra |
|
0.000 0.000 | 0.000 |
0.257 0.209 | 0.294 |
0.000 0.000 | 0.000 |
0.000 0.000 | 0.000 |
0.253 0.189 | 0.306 |
0.384 0.307 | 0.451 |
0.106 0.073 | 0.135 |
0.000 0.000 | 0.000 |
| 2 spectra, QHWFDELPR | 0.000 | 0.385 | 0.000 | 0.000 | 0.121 | 0.300 | 0.193 | 0.000 | ||
| 2 spectra, NVLDTMFELLPR | 0.000 | 0.000 | 0.000 | 0.000 | 0.139 | 0.802 | 0.059 | 0.000 | ||
| 3 spectra, GTSSDITR | 0.000 | 0.363 | 0.000 | 0.000 | 0.136 | 0.501 | 0.000 | 0.000 | ||
| 2 spectra, LLDTLSQMEK | 0.000 | 0.287 | 0.000 | 0.000 | 0.186 | 0.280 | 0.248 | 0.000 | ||
| 1 spectrum, RPAGISYR | 0.085 | 0.205 | 0.000 | 0.000 | 0.503 | 0.000 | 0.206 | 0.000 |
| Plot | Lyso | Other | |||||||||||
| Expt C |
1 peptide |
2 spectra |
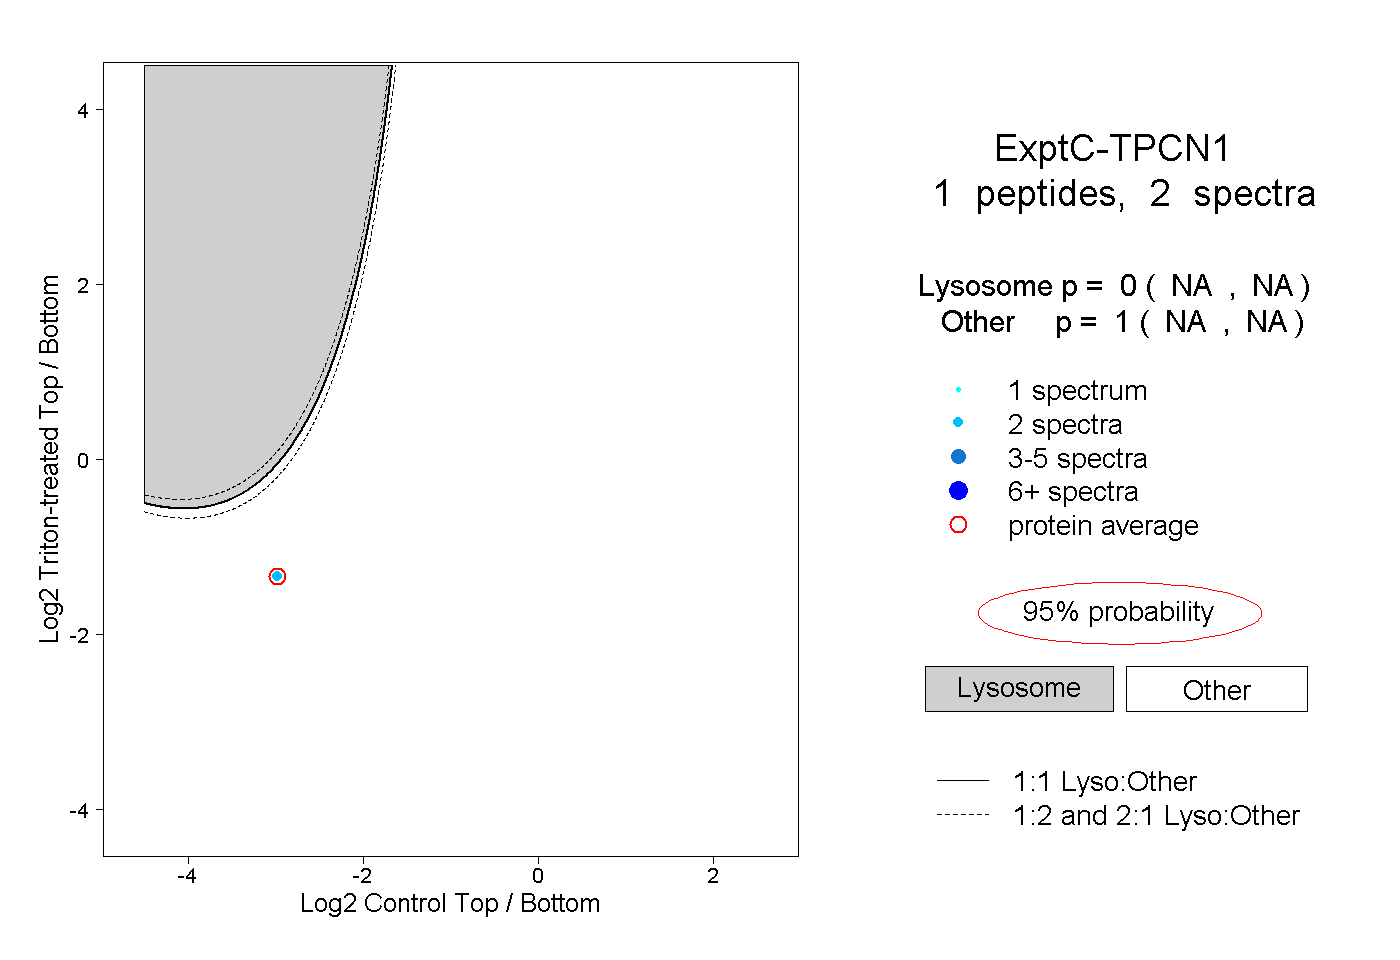 |
0.000 NA | NA |
1.000 NA | NA |
||||||||
| Plot | Lyso | Other | |||||||||||
| Expt D |
1 peptide |
1 spectrum |
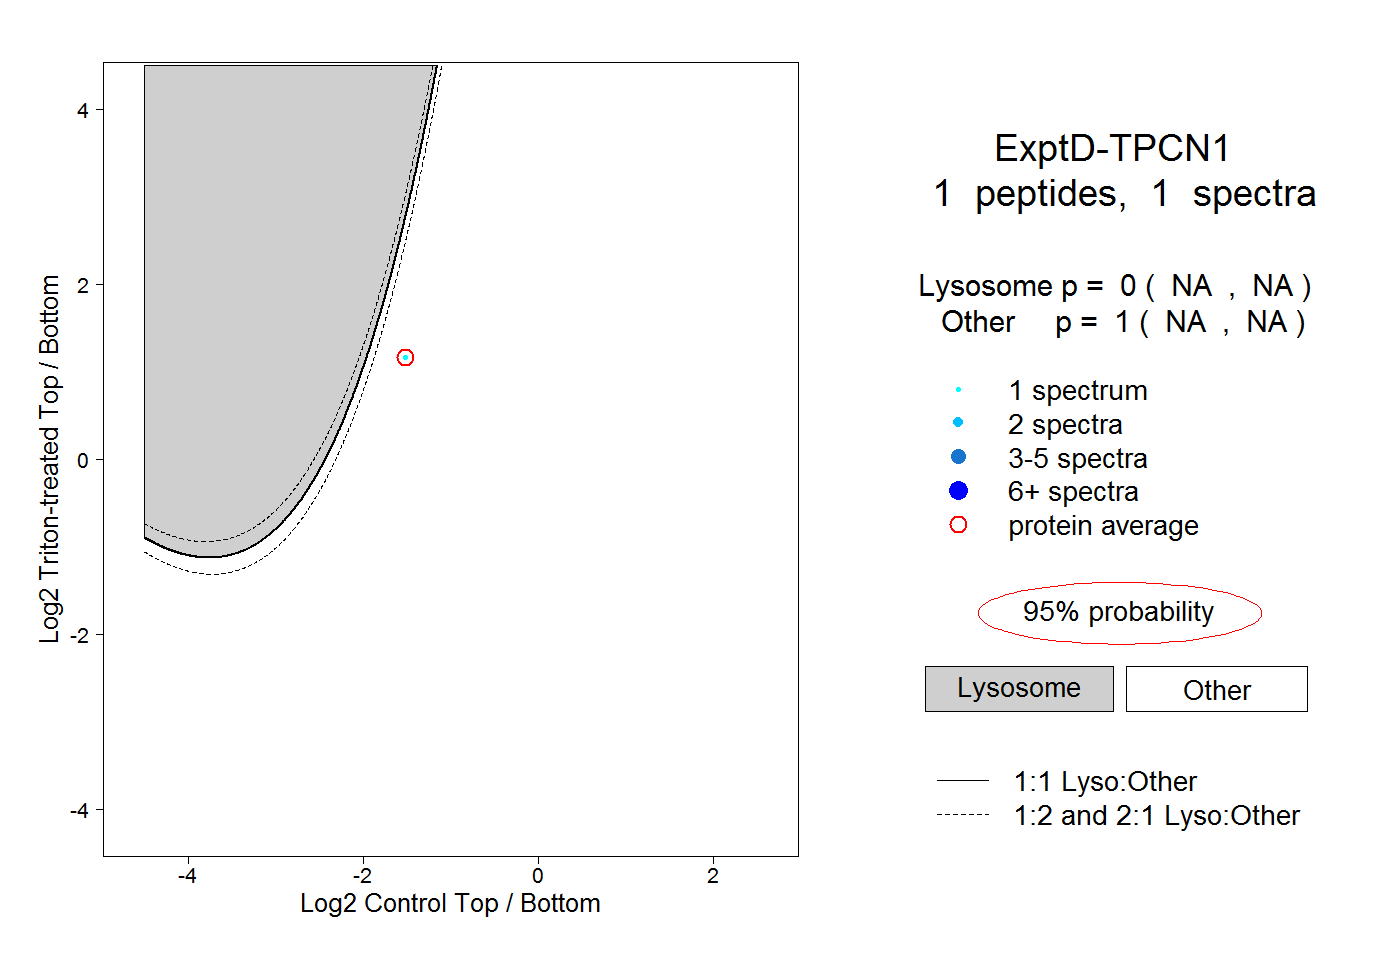 |
0.000 NA | NA |
1.000 NA | NA |