 12
12peptides
spectra
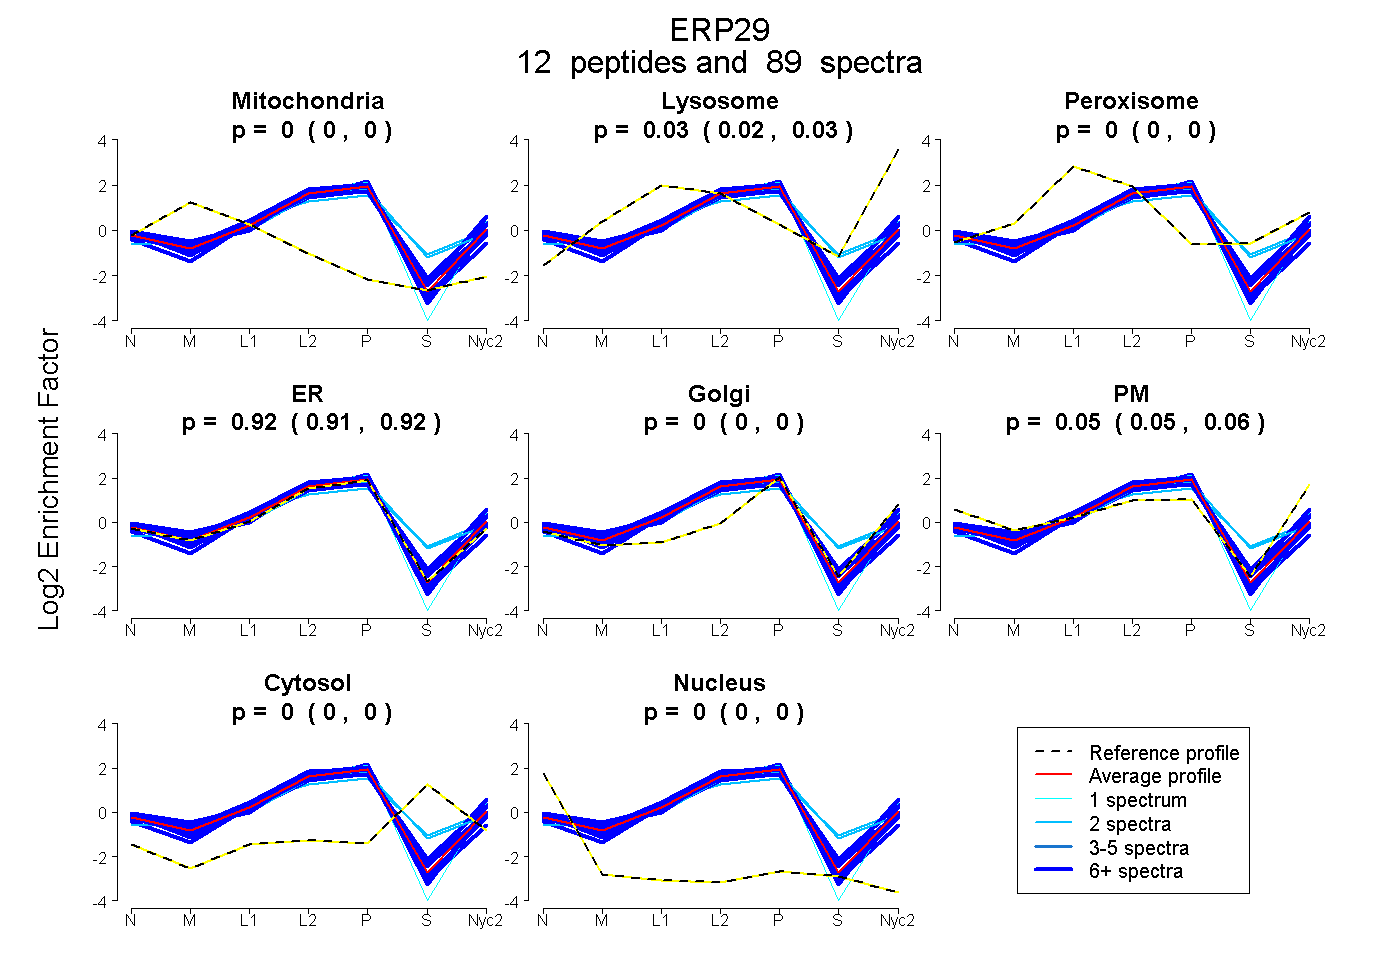
0.000 | 0.000
0.025 | 0.032
0.000 | 0.000
0.911 | 0.922
0.000 | 0.000
0.047 | 0.061
0.000 | 0.000
0.000 | 0.000
7peptides
spectra
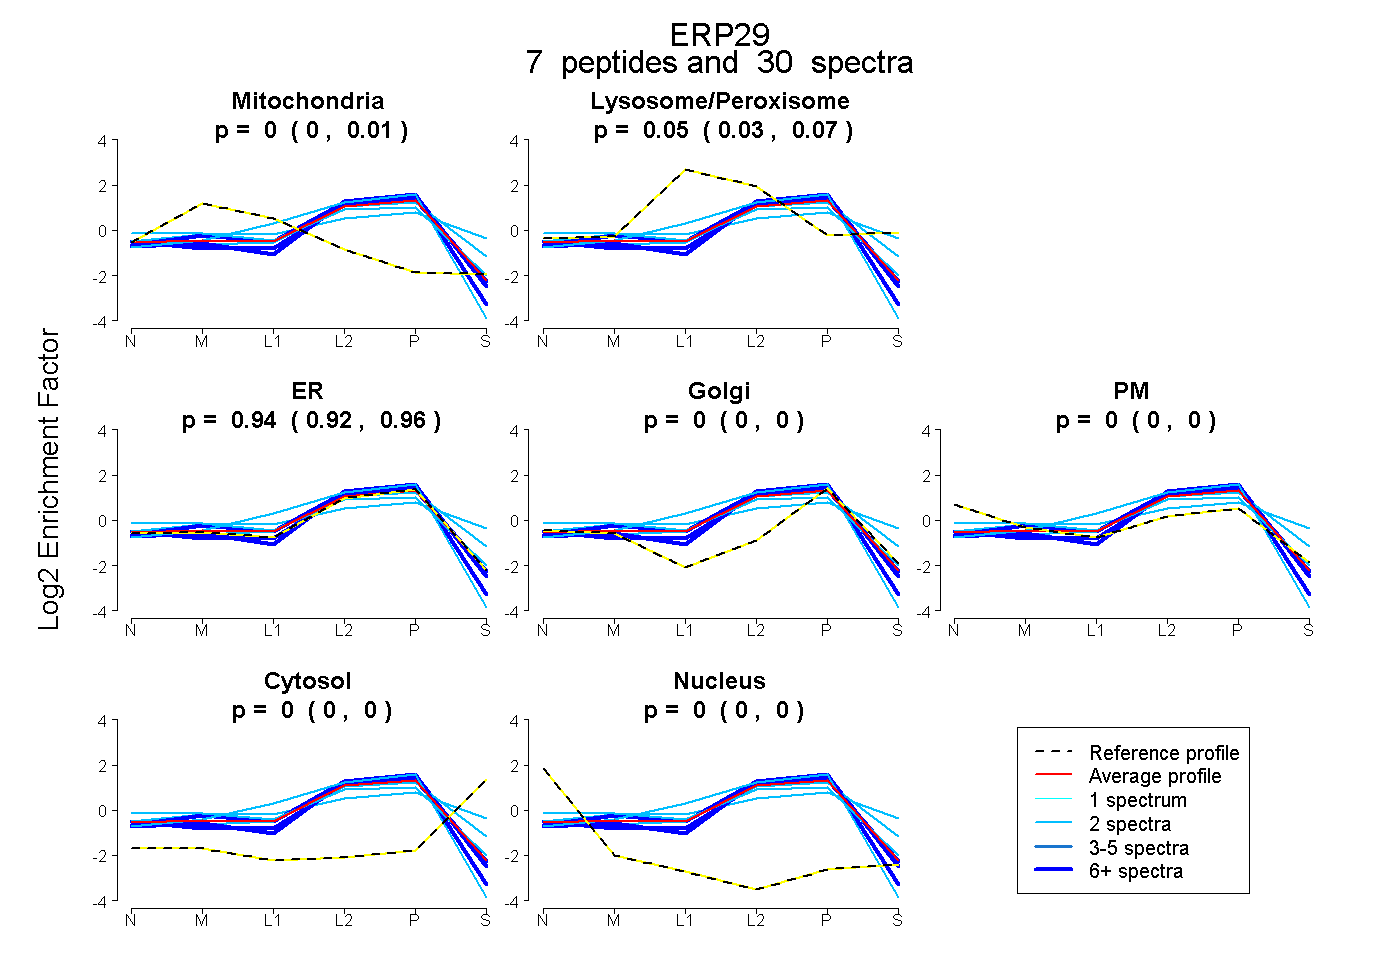
0.000 | 0.012
0.032 | 0.071
0.924 | 0.958
0.000 | 0.000
0.000 | 0.000
0.000 | 0.000
0.000 | 0.000
10peptides
spectra
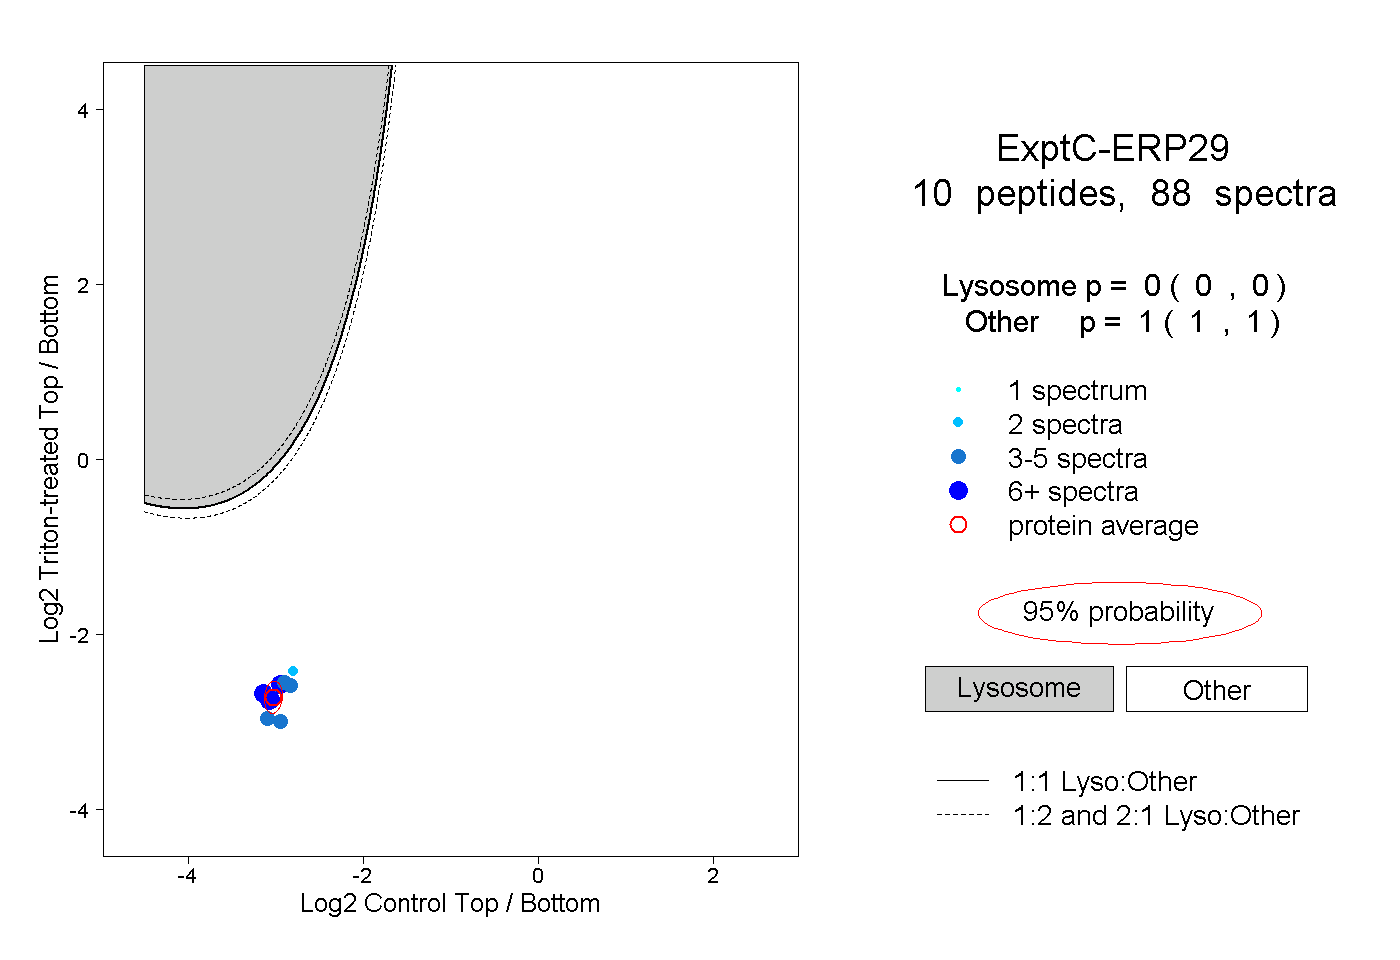
0.000 | 0.000
1.000 | 1.000
4peptides
spectra
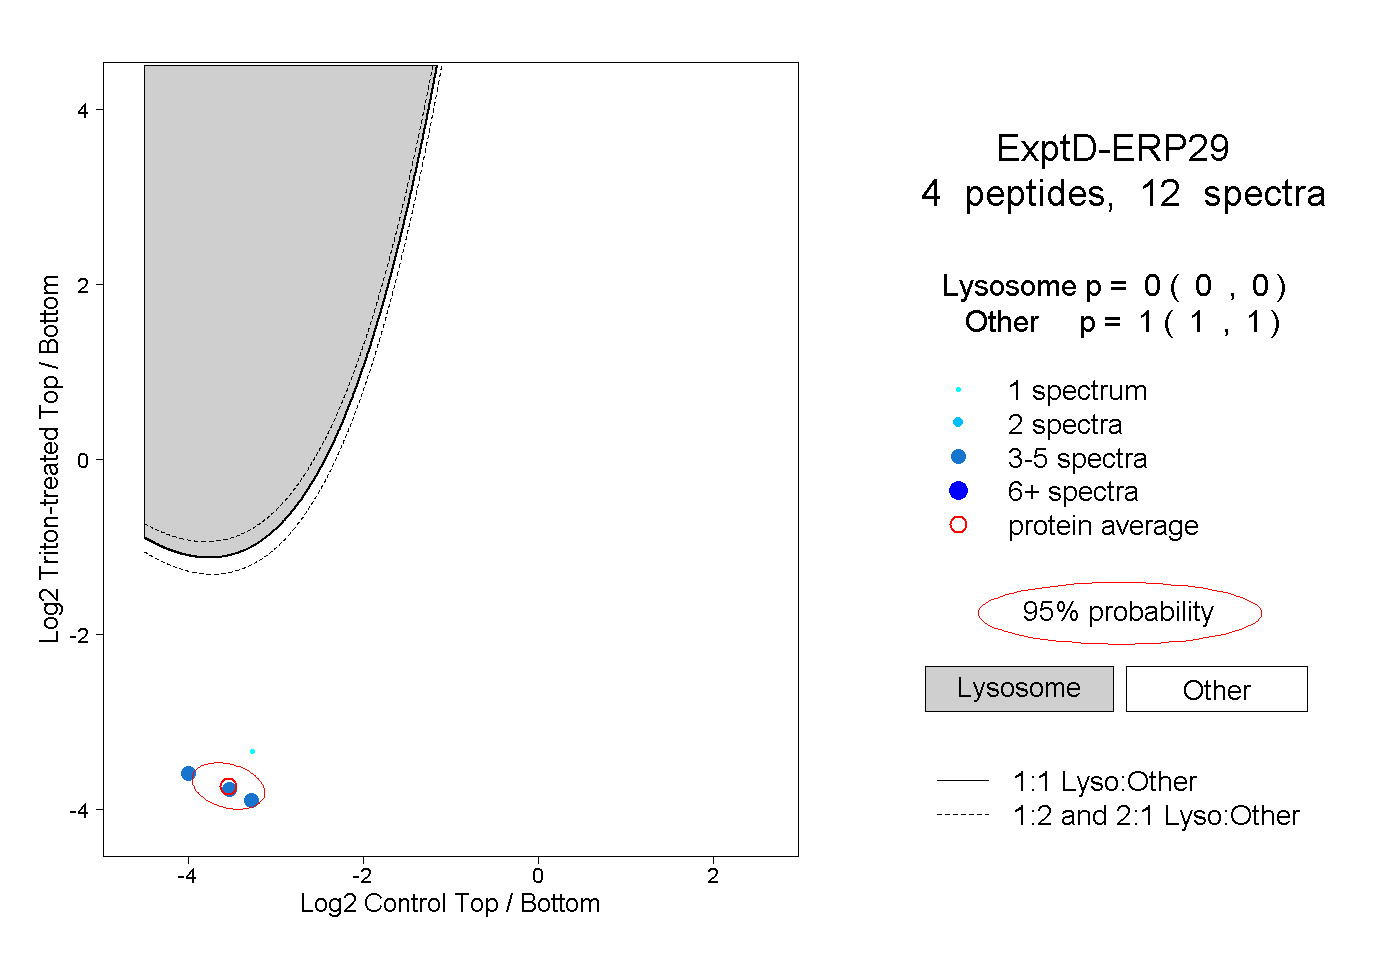
0.000 | 0.000
1.000 | 1.000