 12
12peptides
spectra
0.000 | 0.000
0.025 | 0.032
0.000 | 0.000
0.911 | 0.922
0.000 | 0.000
0.047 | 0.061
0.000 | 0.000
0.000 | 0.000
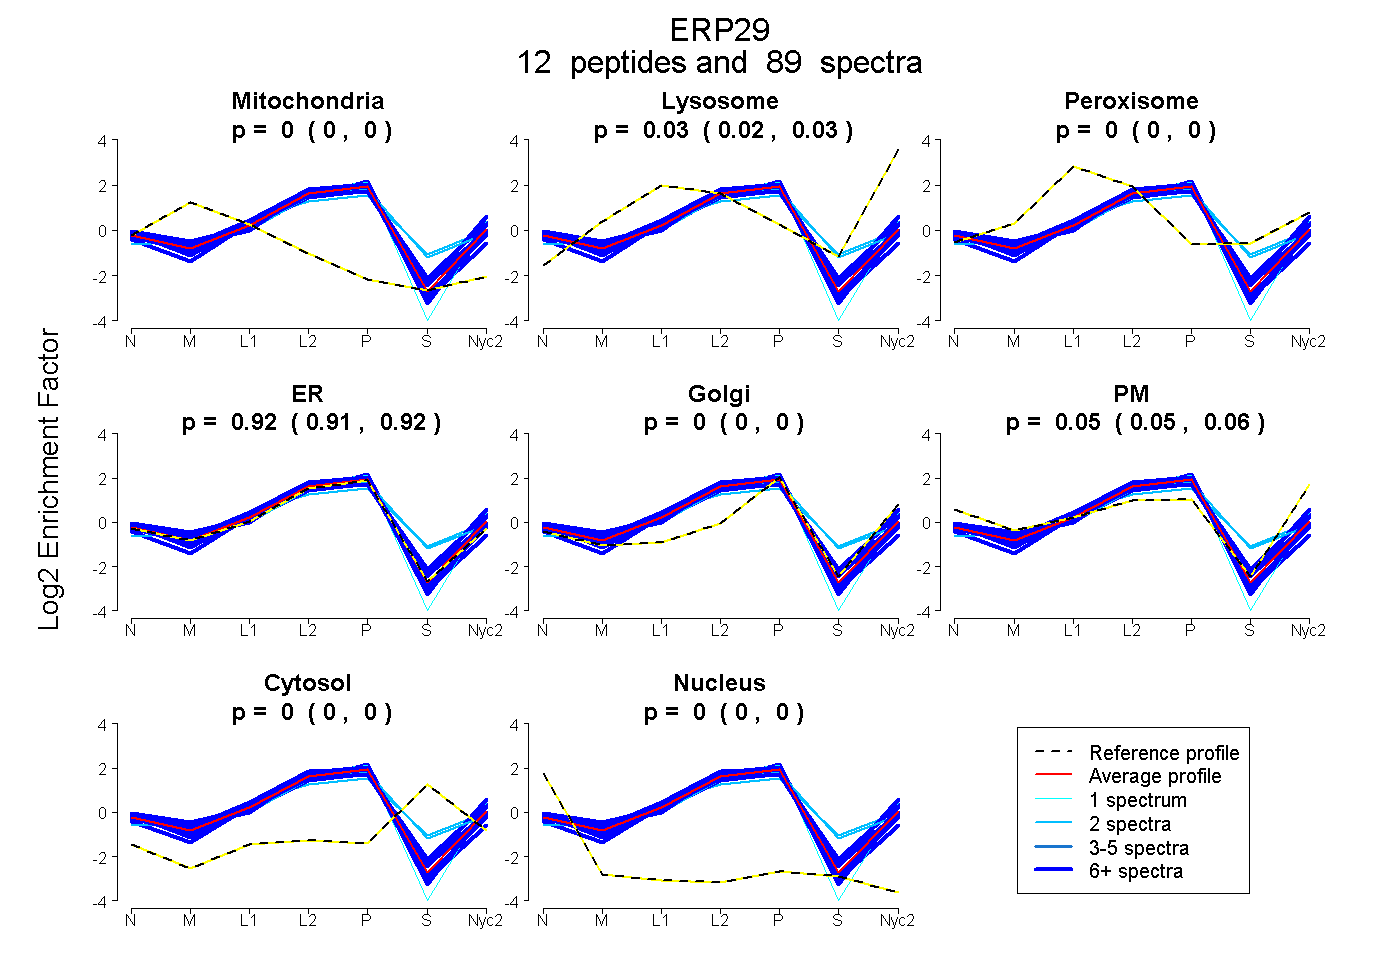
| Plot | Mito | Lyso | Perox | ER | Golgi | PM | Cytosol | Nucleus | |||||
| Expt A |
12 peptides |
89 spectra |
|
0.000 0.000 | 0.000 |
0.029 0.025 | 0.032 |
0.000 0.000 | 0.000 |
0.917 0.911 | 0.922 |
0.000 0.000 | 0.000 |
0.054 0.047 | 0.061 |
0.000 0.000 | 0.000 |
0.000 0.000 | 0.000 |
| 6 spectra, GALPLDTVTFYK | 0.000 | 0.000 | 0.000 | 0.991 | 0.000 | 0.000 | 0.000 | 0.009 | ||
| 23 spectra, SLNILTAFR | 0.000 | 0.004 | 0.000 | 0.882 | 0.000 | 0.113 | 0.000 | 0.000 | ||
| 6 spectra, FDTQYPYGEK | 0.000 | 0.130 | 0.000 | 0.752 | 0.000 | 0.119 | 0.000 | 0.000 | ||
| 9 spectra, ESYPVFYLFR | 0.000 | 0.000 | 0.000 | 0.972 | 0.000 | 0.028 | 0.000 | 0.000 | ||
| 6 spectra, LNMELSEK | 0.000 | 0.115 | 0.015 | 0.726 | 0.076 | 0.052 | 0.016 | 0.000 | ||
| 1 spectrum, QDEFK | 0.000 | 0.000 | 0.000 | 0.882 | 0.000 | 0.118 | 0.000 | 0.000 | ||
| 6 spectra, WASQYLK | 0.007 | 0.000 | 0.051 | 0.813 | 0.000 | 0.129 | 0.000 | 0.000 | ||
| 6 spectra, QGQDGLSGVK | 0.000 | 0.000 | 0.000 | 0.967 | 0.000 | 0.033 | 0.000 | 0.000 | ||
| 2 spectra, DGDFENPVPYSGAVK | 0.000 | 0.000 | 0.207 | 0.599 | 0.064 | 0.000 | 0.130 | 0.000 | ||
| 2 spectra, MSEGK | 0.000 | 0.064 | 0.067 | 0.745 | 0.000 | 0.000 | 0.123 | 0.000 | ||
| 16 spectra, VGAIQR | 0.000 | 0.000 | 0.000 | 0.984 | 0.000 | 0.016 | 0.000 | 0.000 | ||
| 6 spectra, ILDQGEDFPASELAR | 0.000 | 0.000 | 0.040 | 0.879 | 0.000 | 0.060 | 0.021 | 0.000 |
| Plot | Mito | Lyso or Perox | ER | Golgi | PM | Cytosol | Nucleus | ||||||
| Expt B |
7 peptides |
30 spectra |
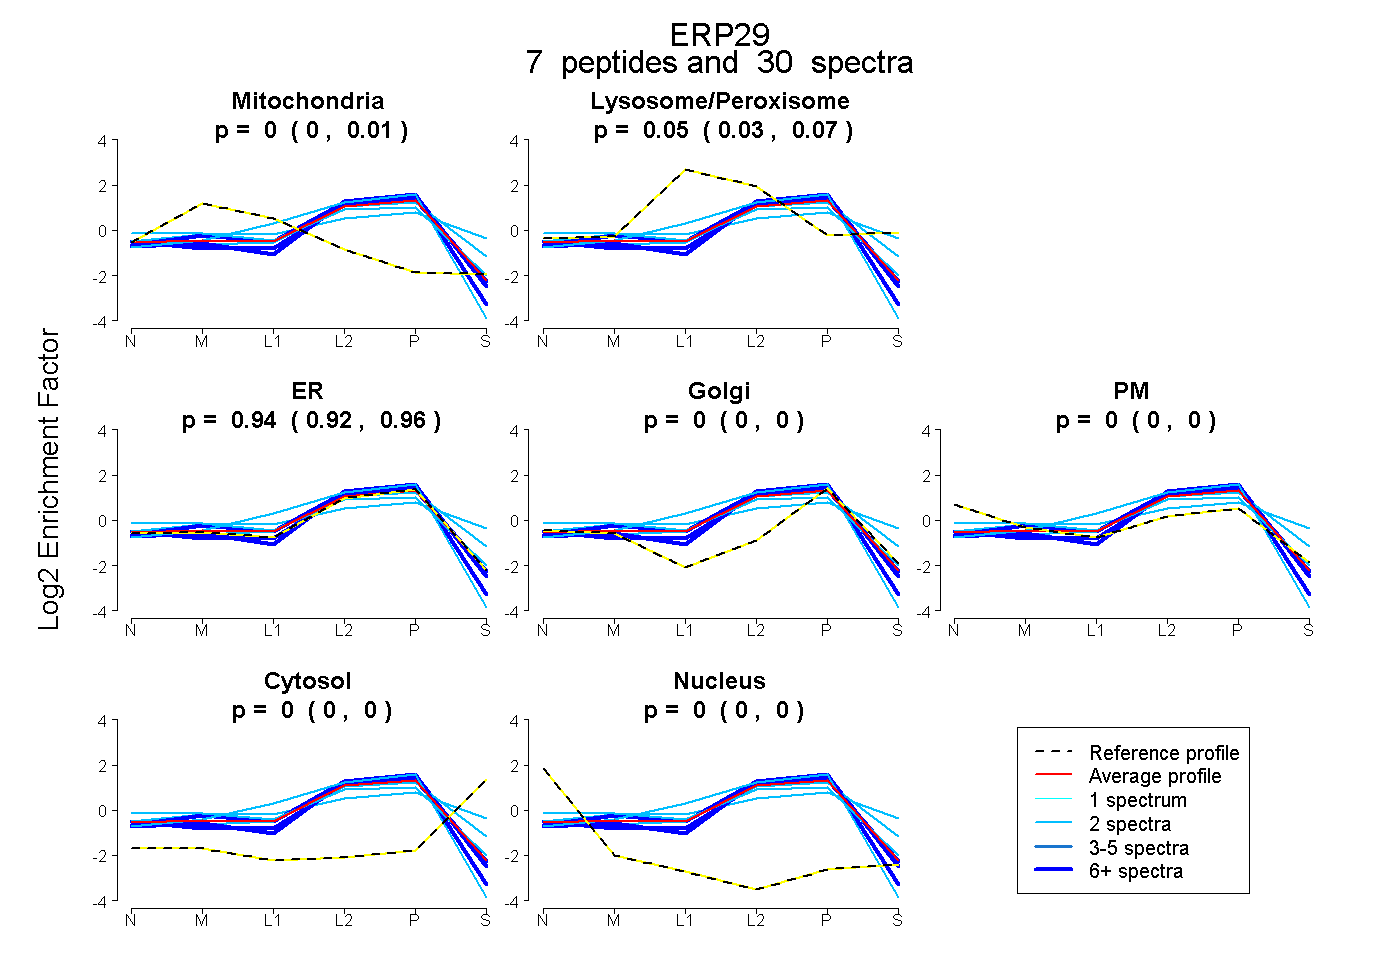 |
0.001 0.000 | 0.012 |
0.054 0.032 | 0.071 |
0.945 0.924 | 0.958 |
0.000 0.000 | 0.000 |
0.000 0.000 | 0.000 |
0.000 0.000 | 0.000 |
0.000 0.000 | 0.000 |
|||
| Plot | Lyso | Other | |||||||||||
| Expt C |
10 peptides |
88 spectra |
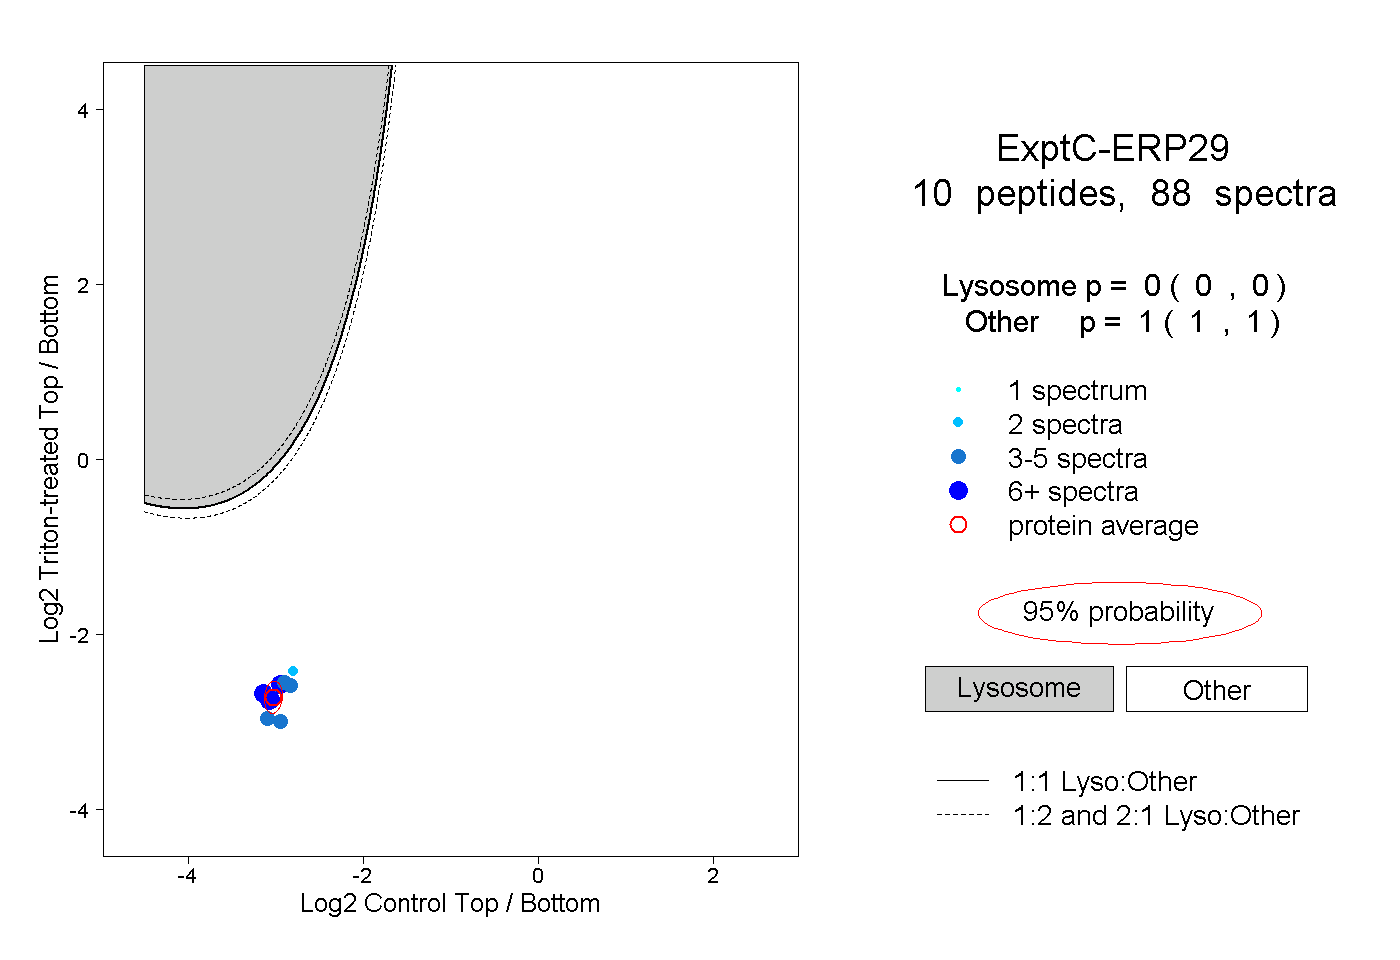 |
0.000 0.000 | 0.000 |
1.000 1.000 | 1.000 |
||||||||
| Plot | Lyso | Other | |||||||||||
| Expt D |
4 peptides |
12 spectra |
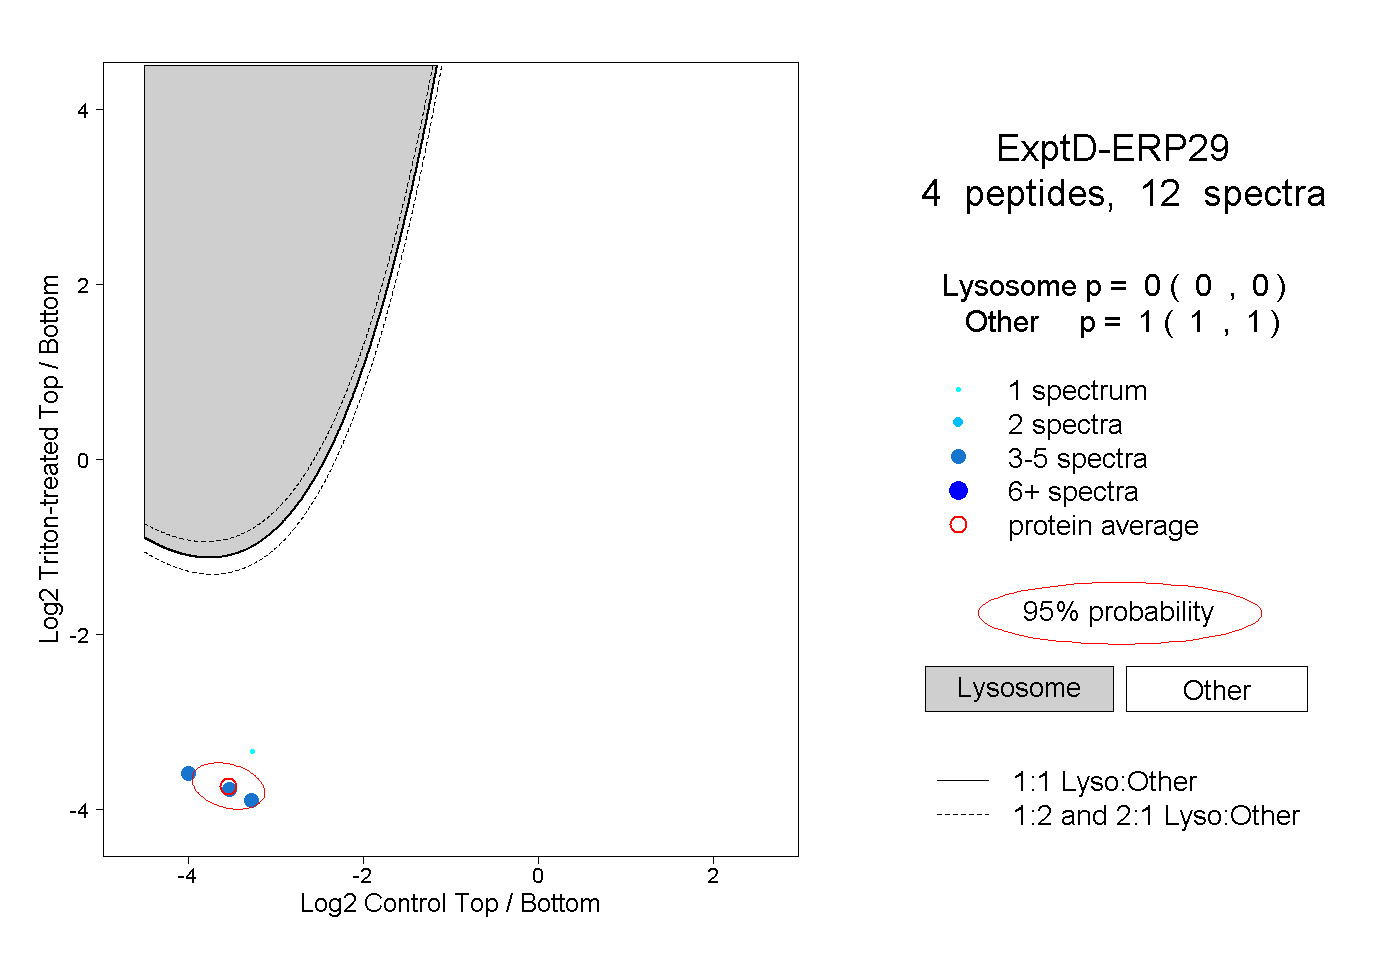 |
0.000 0.000 | 0.000 |
1.000 1.000 | 1.000 |