 7
7peptides
spectra
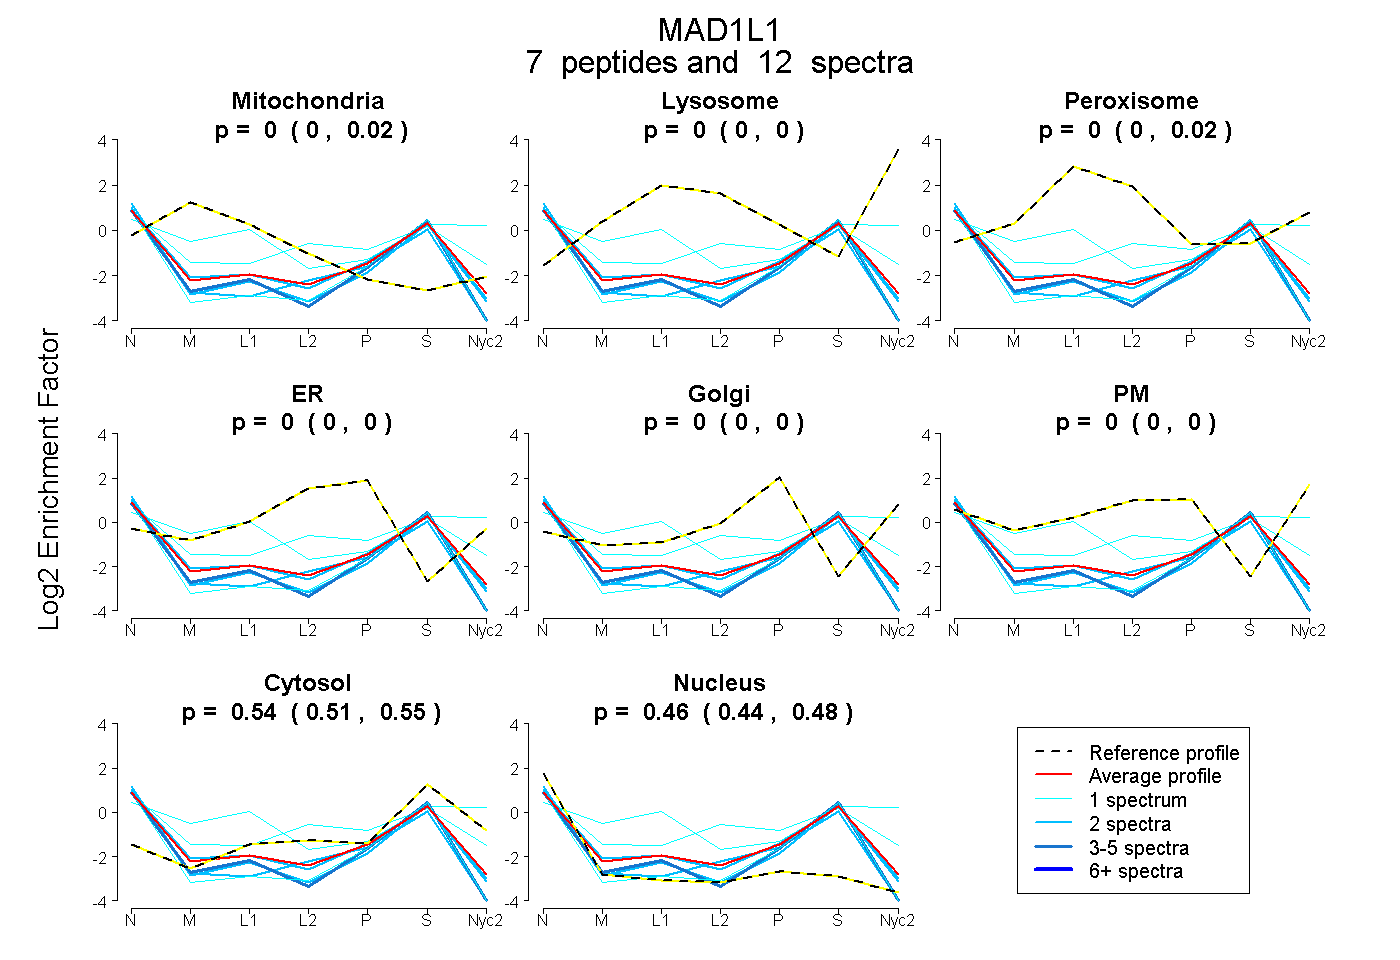
0.000 | 0.016
0.000 | 0.000
0.000 | 0.018
0.000 | 0.000
0.000 | 0.000
0.000 | 0.000
0.510 | 0.553
0.436 | 0.484
3peptides
spectra
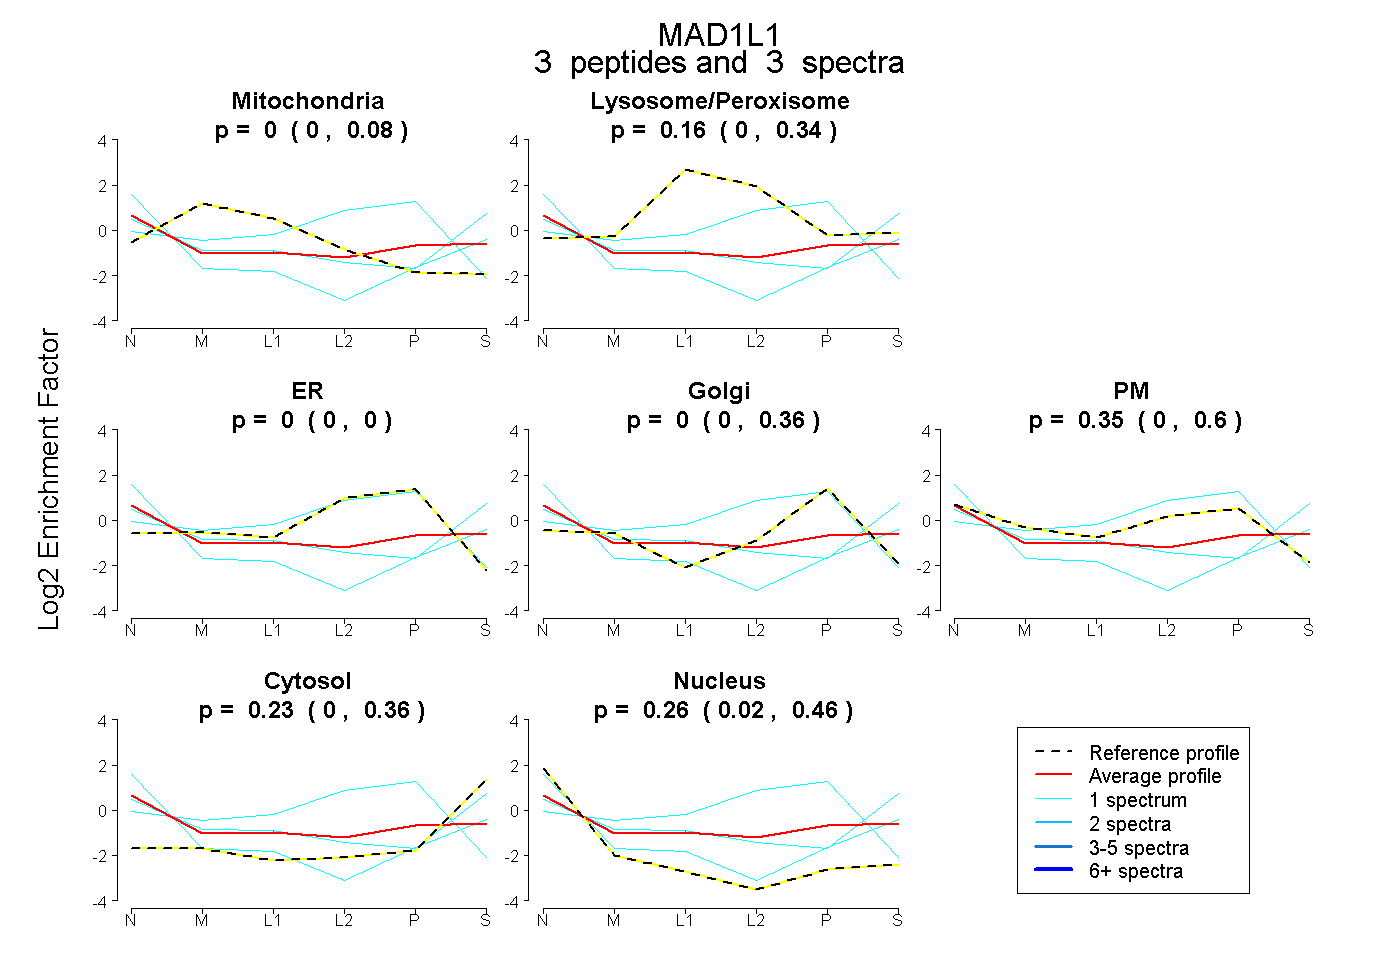
0.000 | 0.081
0.000 | 0.341
0.000 | 0.003
0.000 | 0.360
0.000 | 0.602
0.000 | 0.362
0.016 | 0.461
2peptides
spectra
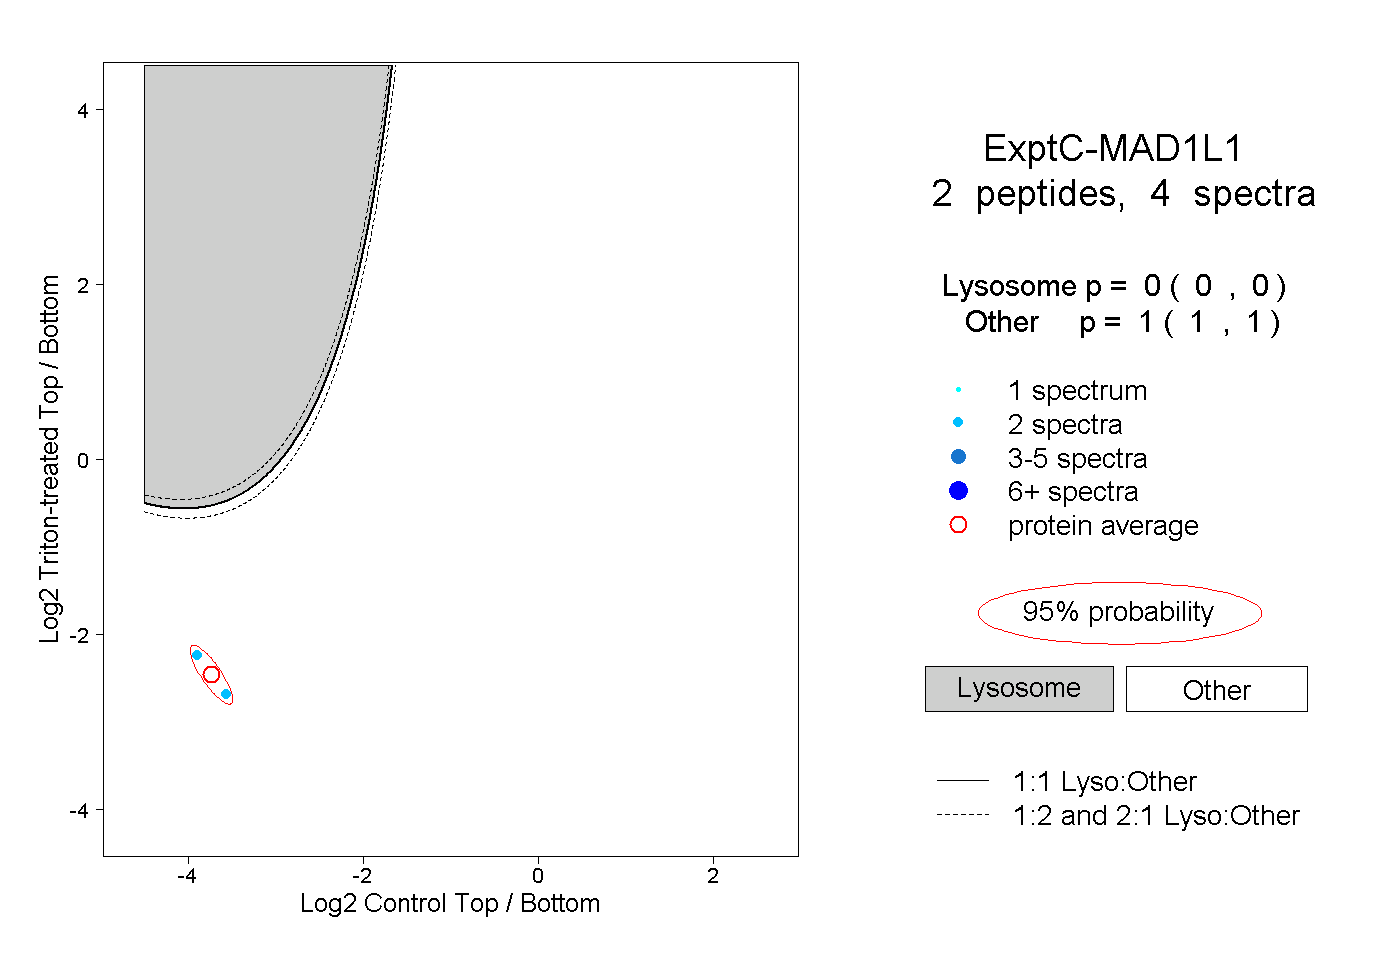
0.000 | 0.000
1.000 | 1.000