 14
14peptides
spectra
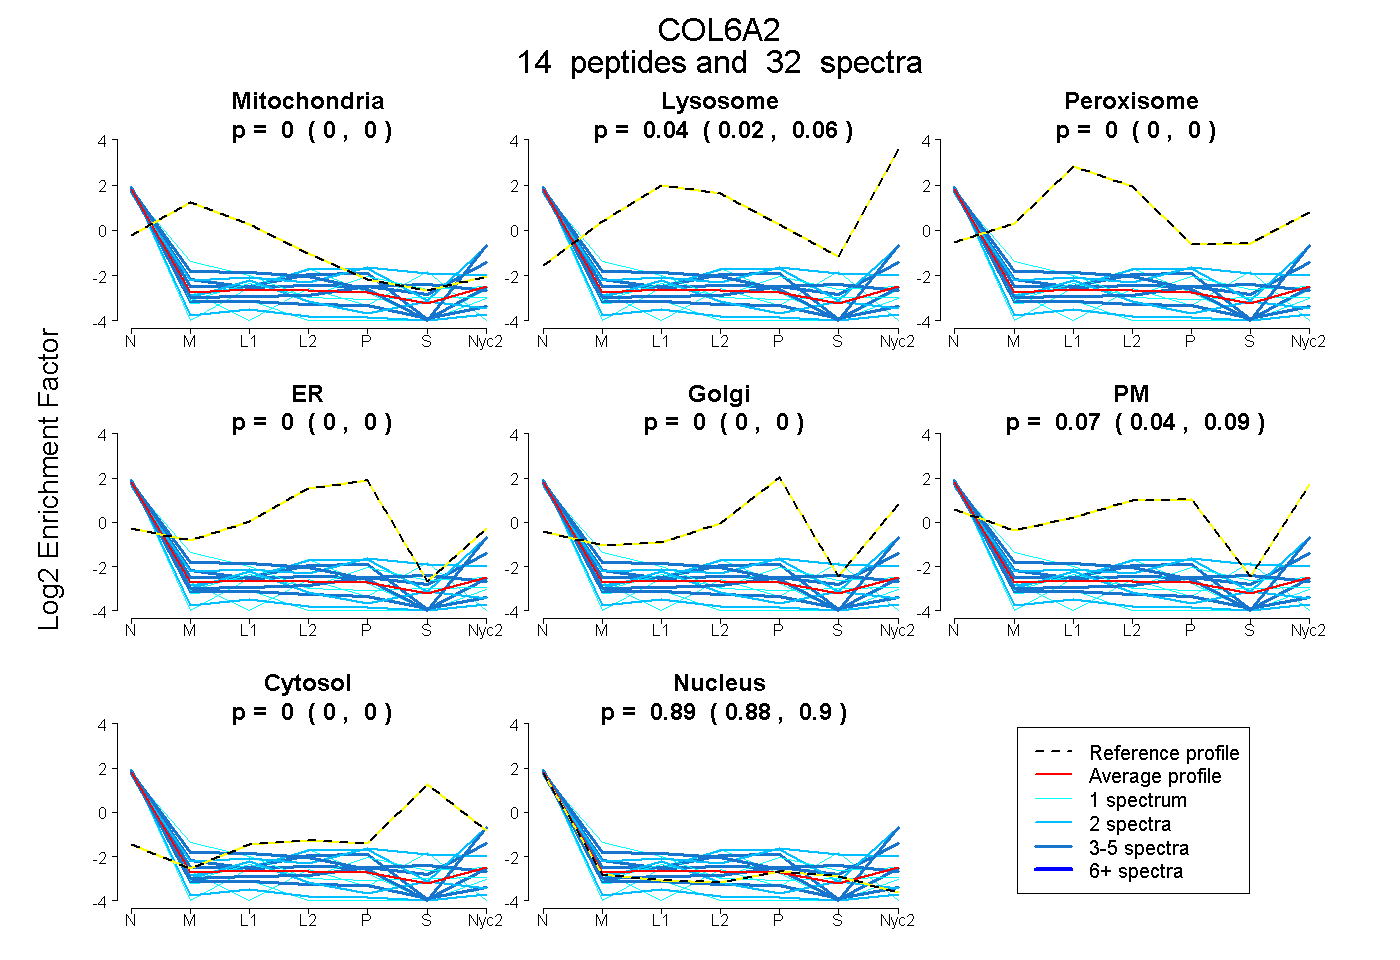
0.000 | 0.000
0.025 | 0.060
0.000 | 0.000
0.000 | 0.000
0.000 | 0.000
0.039 | 0.087
0.000 | 0.000
0.879 | 0.900
2peptides
spectra
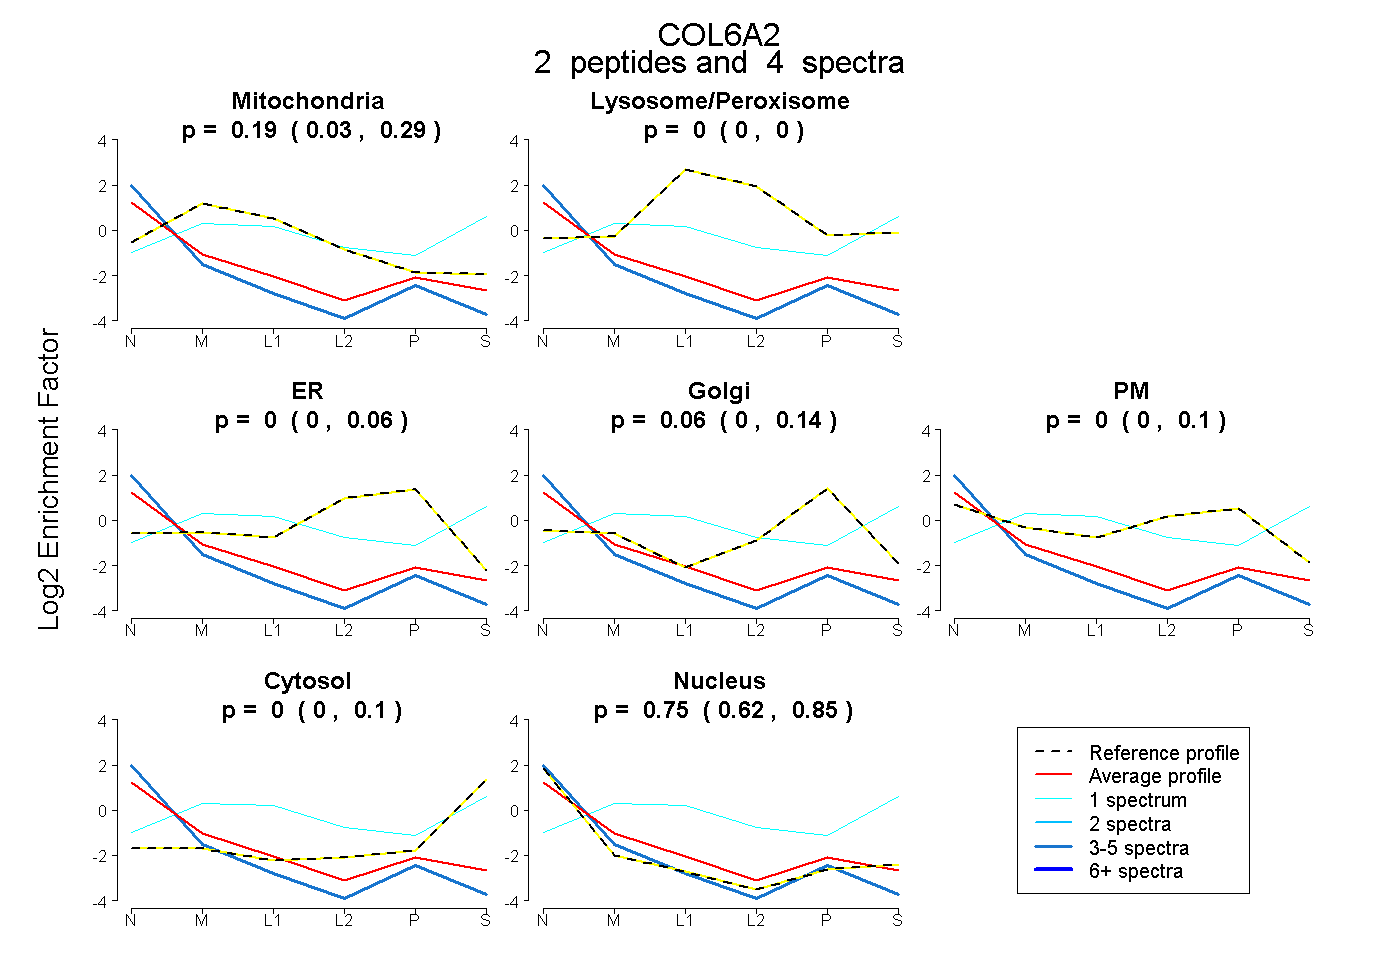
0.030 | 0.285
0.000 | 0.000
0.000 | 0.062
0.000 | 0.136
0.000 | 0.102
0.000 | 0.099
0.618 | 0.849
12peptides
spectra
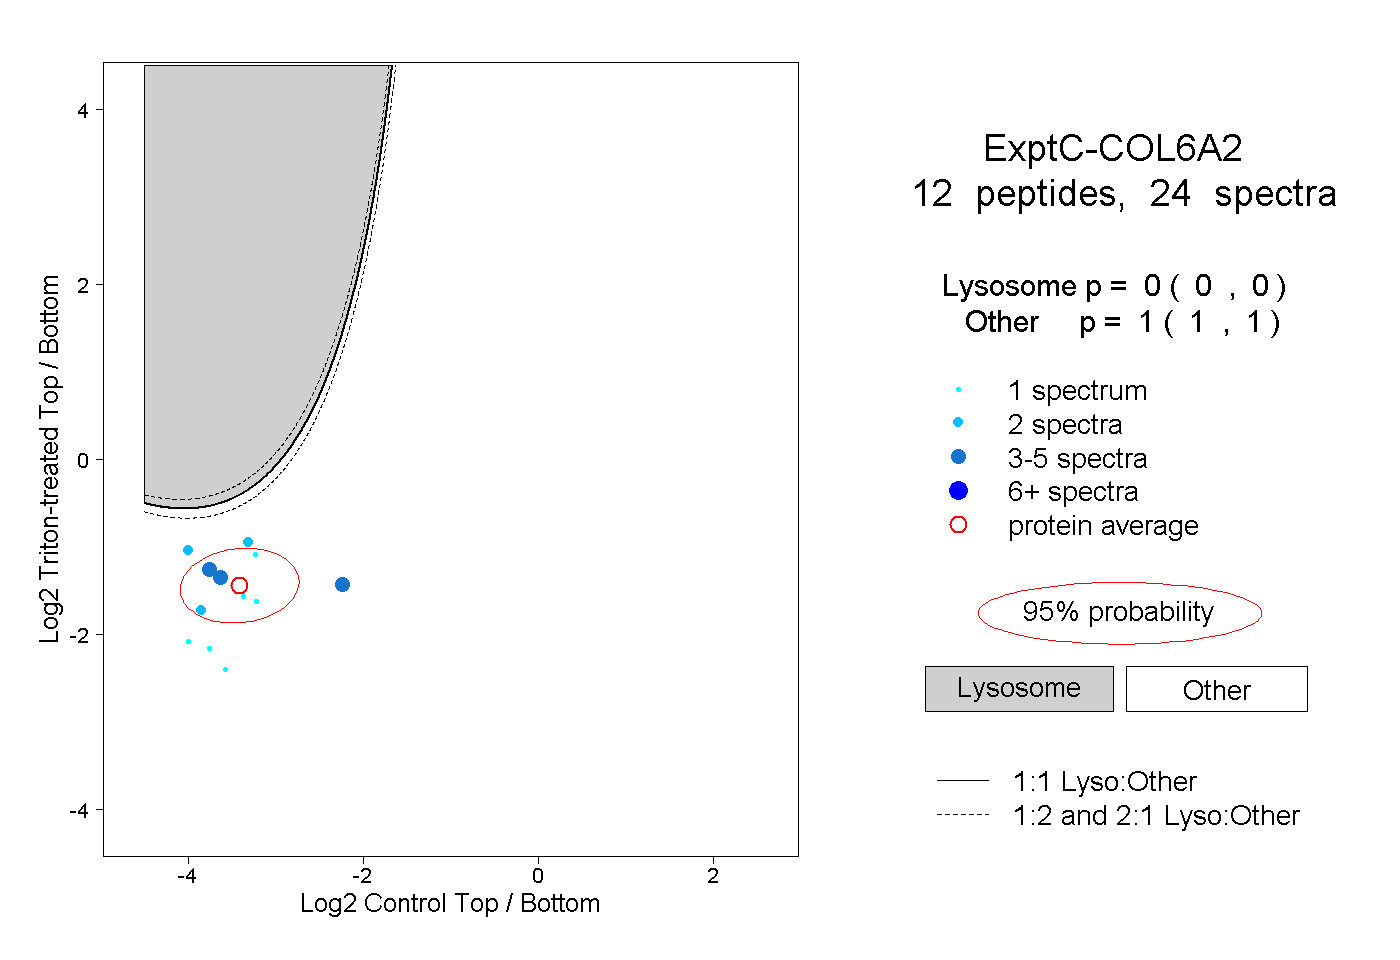
0.000 | 0.000
1.000 | 1.000
1peptide
spectrum

NA | NA
NA | NA