 14
14peptides
spectra
0.000 | 0.000
0.025 | 0.060
0.000 | 0.000
0.000 | 0.000
0.000 | 0.000
0.039 | 0.087
0.000 | 0.000
0.879 | 0.900
| Plot | Mito | Lyso | Perox | ER | Golgi | PM | Cytosol | Nucleus | |||||
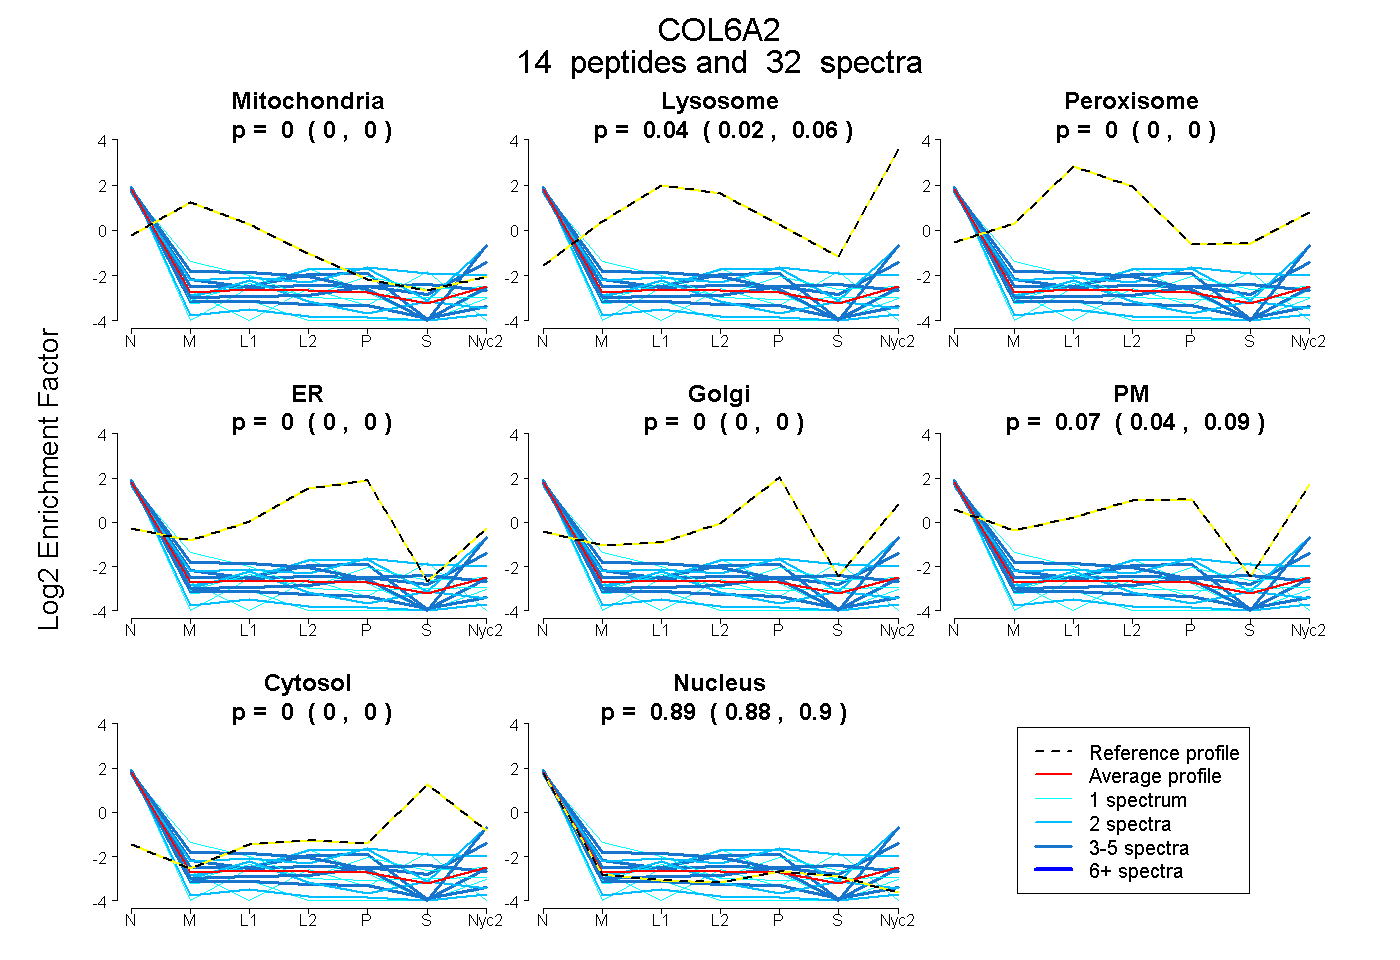
| Expt A |
14 peptides |
32 spectra |
|
0.000 0.000 | 0.000 |
0.045 0.025 | 0.060 |
0.000 0.000 | 0.000 |
0.000 0.000 | 0.000 |
0.000 0.000 | 0.000 |
0.065 0.039 | 0.087 |
0.000 0.000 | 0.000 |
0.890 0.879 | 0.900 |
| 2 spectra, NLNEQGLR | 0.000 | 0.000 | 0.000 | 0.000 | 0.000 | 0.207 | 0.131 | 0.662 | ||
| 1 spectrum, LGEQNFYK | 0.278 | 0.000 | 0.000 | 0.000 | 0.000 | 0.000 | 0.000 | 0.722 | ||
| 2 spectra, GDPGDAGPR | 0.000 | 0.000 | 0.000 | 0.000 | 0.000 | 0.000 | 0.000 | 1.000 | ||
| 3 spectra, VFAVVITDGR | 0.000 | 0.000 | 0.000 | 0.000 | 0.000 | 0.048 | 0.091 | 0.861 | ||
| 2 spectra, NNYATMRPDSTEIDQDTINR | 0.047 | 0.000 | 0.000 | 0.000 | 0.000 | 0.000 | 0.000 | 0.953 | ||
| 3 spectra, GPQGALGEPGK | 0.000 | 0.000 | 0.000 | 0.000 | 0.000 | 0.000 | 0.000 | 1.000 | ||
| 1 spectrum, DDDLNLR | 0.000 | 0.000 | 0.000 | 0.000 | 0.000 | 0.000 | 0.000 | 1.000 | ||
| 5 spectra, LFAVAPNR | 0.000 | 0.000 | 0.000 | 0.044 | 0.000 | 0.162 | 0.000 | 0.794 | ||
| 1 spectrum, ETCGCCDCEK | 0.000 | 0.000 | 0.000 | 0.000 | 0.000 | 0.000 | 0.053 | 0.947 | ||
| 1 spectrum, LTLAR | 0.000 | 0.000 | 0.000 | 0.000 | 0.000 | 0.122 | 0.041 | 0.837 | ||
| 2 spectra, HEAYGECYK | 0.000 | 0.000 | 0.000 | 0.000 | 0.000 | 0.346 | 0.000 | 0.654 | ||
| 4 spectra, VGVVQYSHEGTFEAIR | 0.006 | 0.059 | 0.000 | 0.000 | 0.000 | 0.263 | 0.000 | 0.672 | ||
| 4 spectra, FAYNQLIK | 0.000 | 0.124 | 0.000 | 0.000 | 0.000 | 0.086 | 0.000 | 0.790 | ||
| 1 spectrum, DIANTPHELYR | 0.000 | 0.000 | 0.000 | 0.000 | 0.000 | 0.124 | 0.000 | 0.876 |
| Plot | Mito | Lyso or Perox | ER | Golgi | PM | Cytosol | Nucleus | ||||||
| Expt B |
2 peptides |
4 spectra |
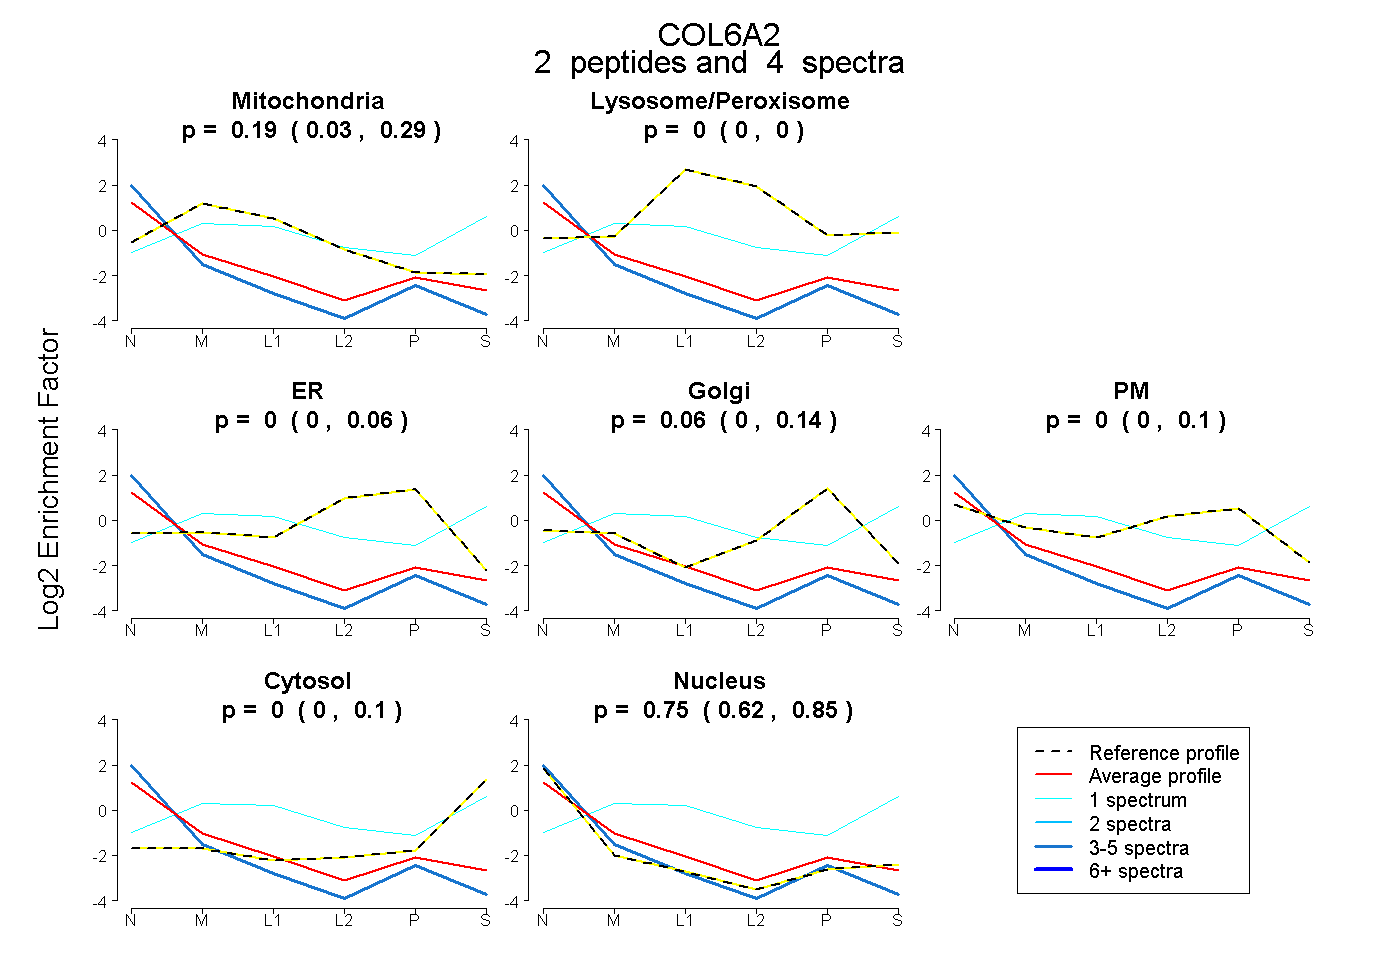 |
0.188 0.030 | 0.285 |
0.000 0.000 | 0.000 |
0.000 0.000 | 0.062 |
0.059 0.000 | 0.136 |
0.000 0.000 | 0.102 |
0.000 0.000 | 0.099 |
0.752 0.618 | 0.849 |
|||
| Plot | Lyso | Other | |||||||||||
| Expt C |
12 peptides |
24 spectra |
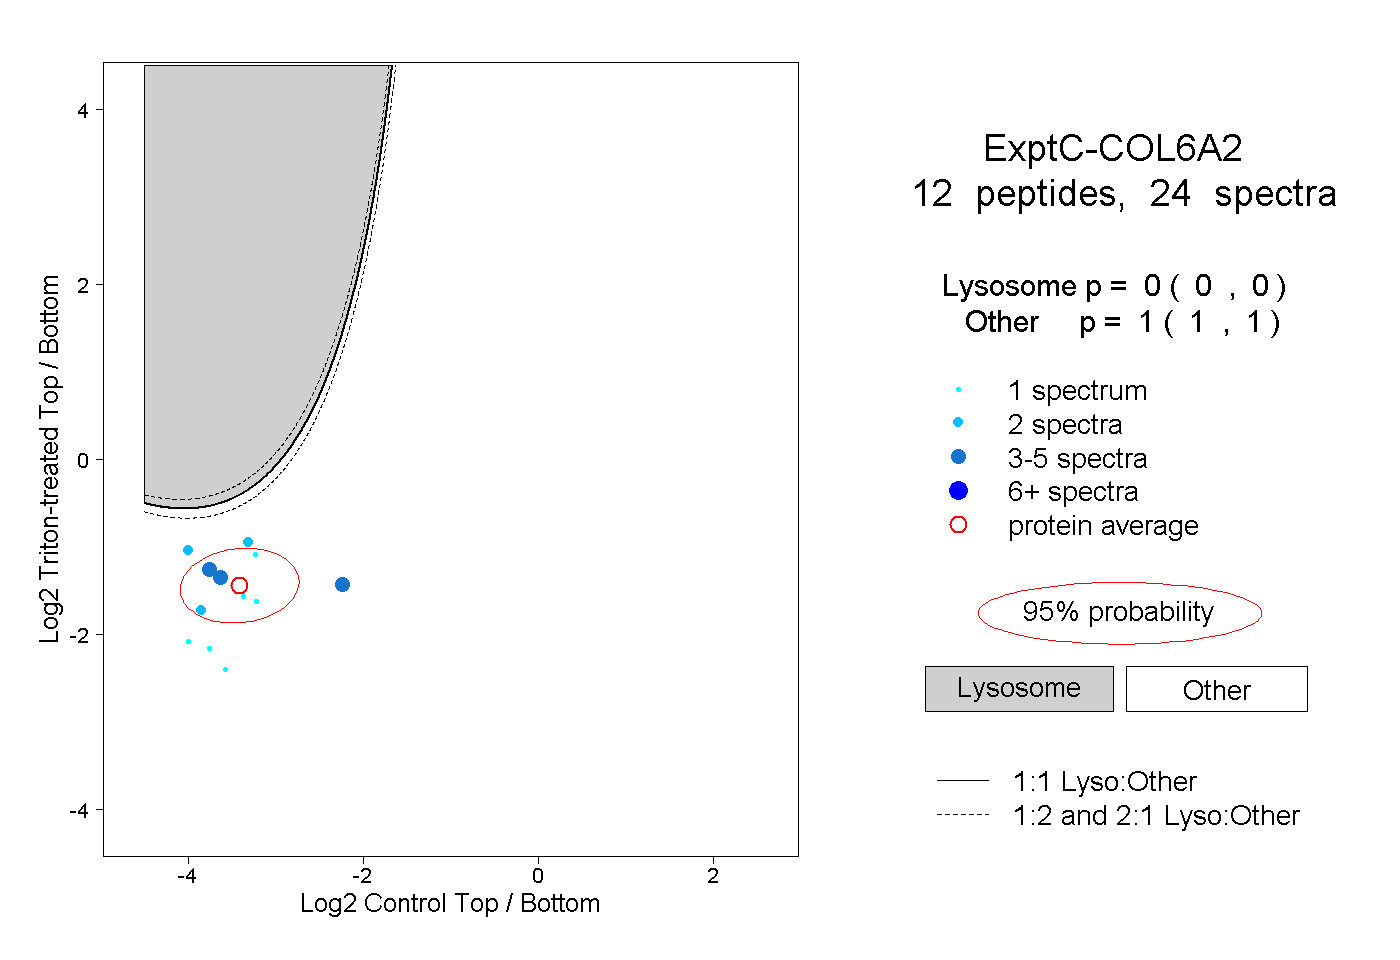 |
0.000 0.000 | 0.000 |
1.000 1.000 | 1.000 |
||||||||
| Plot | Lyso | Other | |||||||||||
| Expt D |
1 peptide |
1 spectrum |
 |
0.000 NA | NA |
1.000 NA | NA |