 6
6peptides
spectra

0.024 | 0.077
0.000 | 0.000
0.137 | 0.205
0.000 | 0.128
0.000 | 0.123
0.000 | 0.000
0.619 | 0.674
0.000 | 0.000
7peptides
spectra
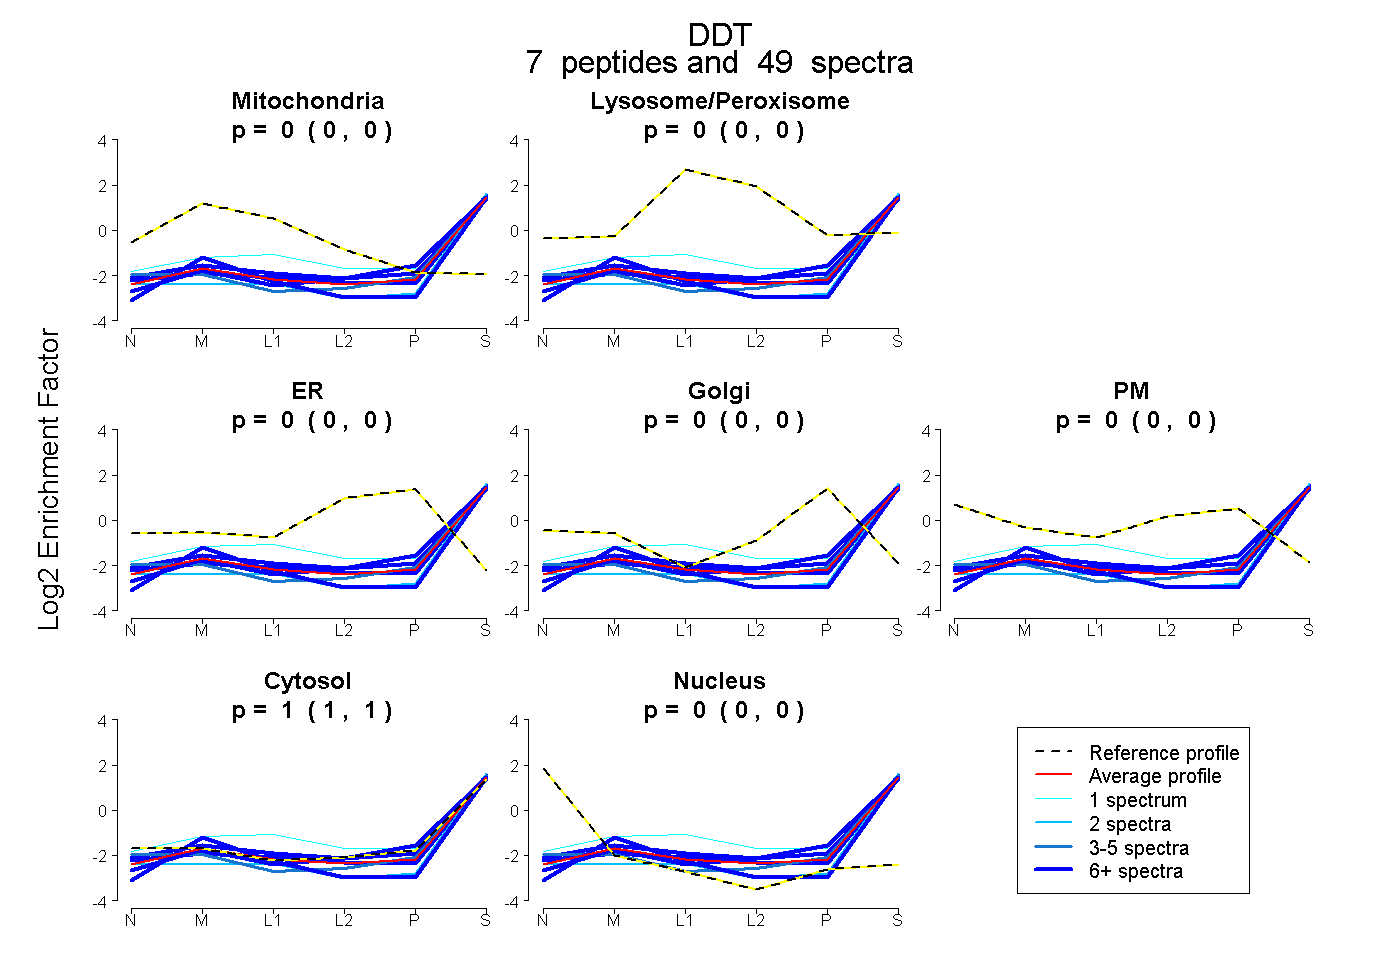
0.000 | 0.000
0.000 | 0.000
0.000 | 0.000
0.000 | 0.000
0.000 | 0.000
1.000 | 1.000
0.000 | 0.000
7peptides
spectra
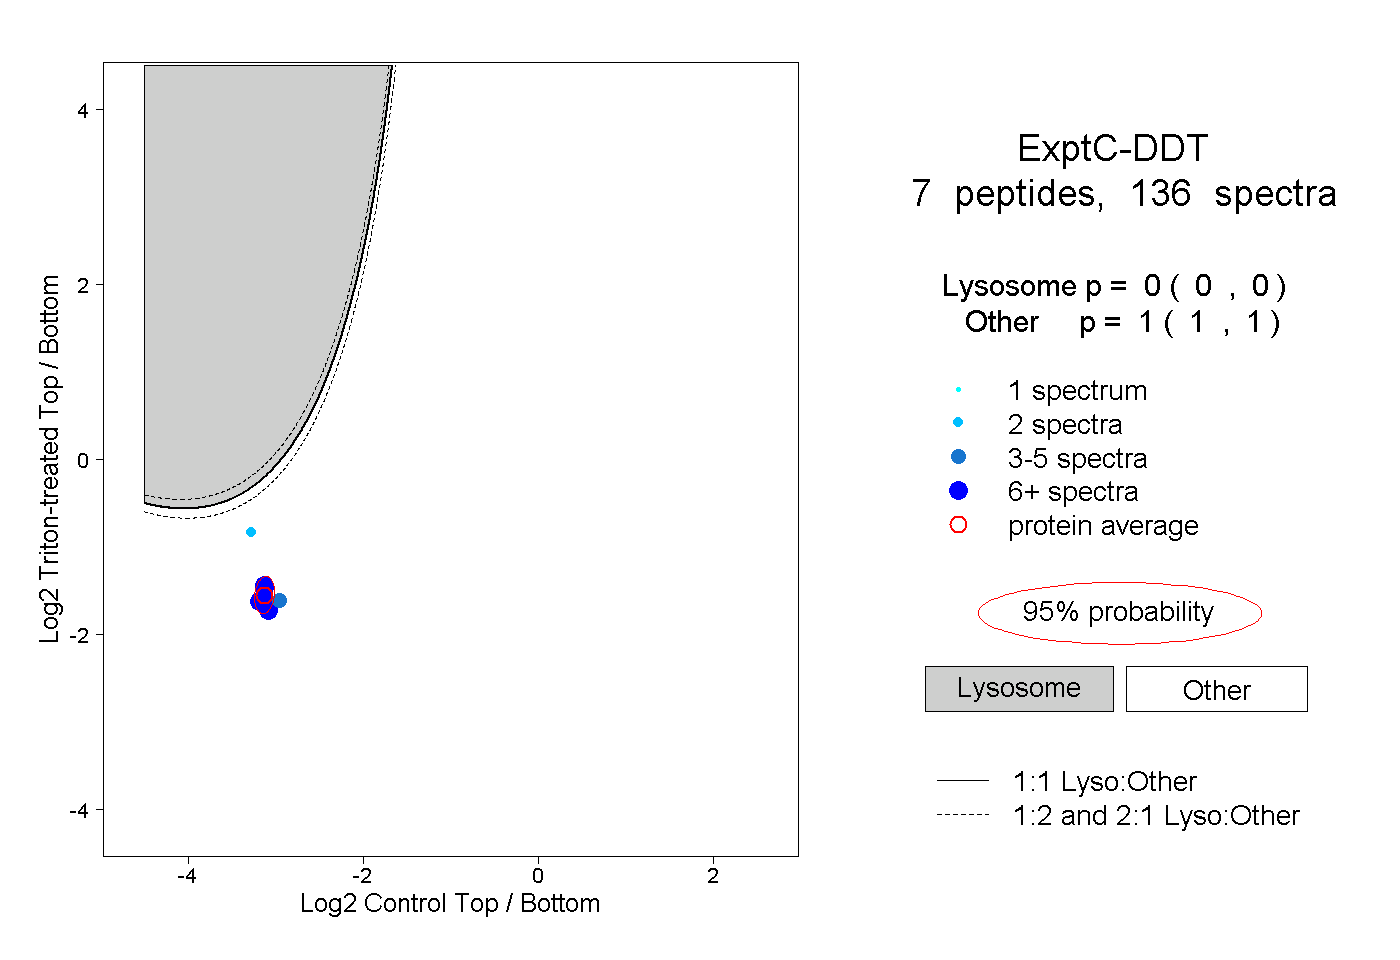
0.000 | 0.000
1.000 | 1.000
2peptides
spectra
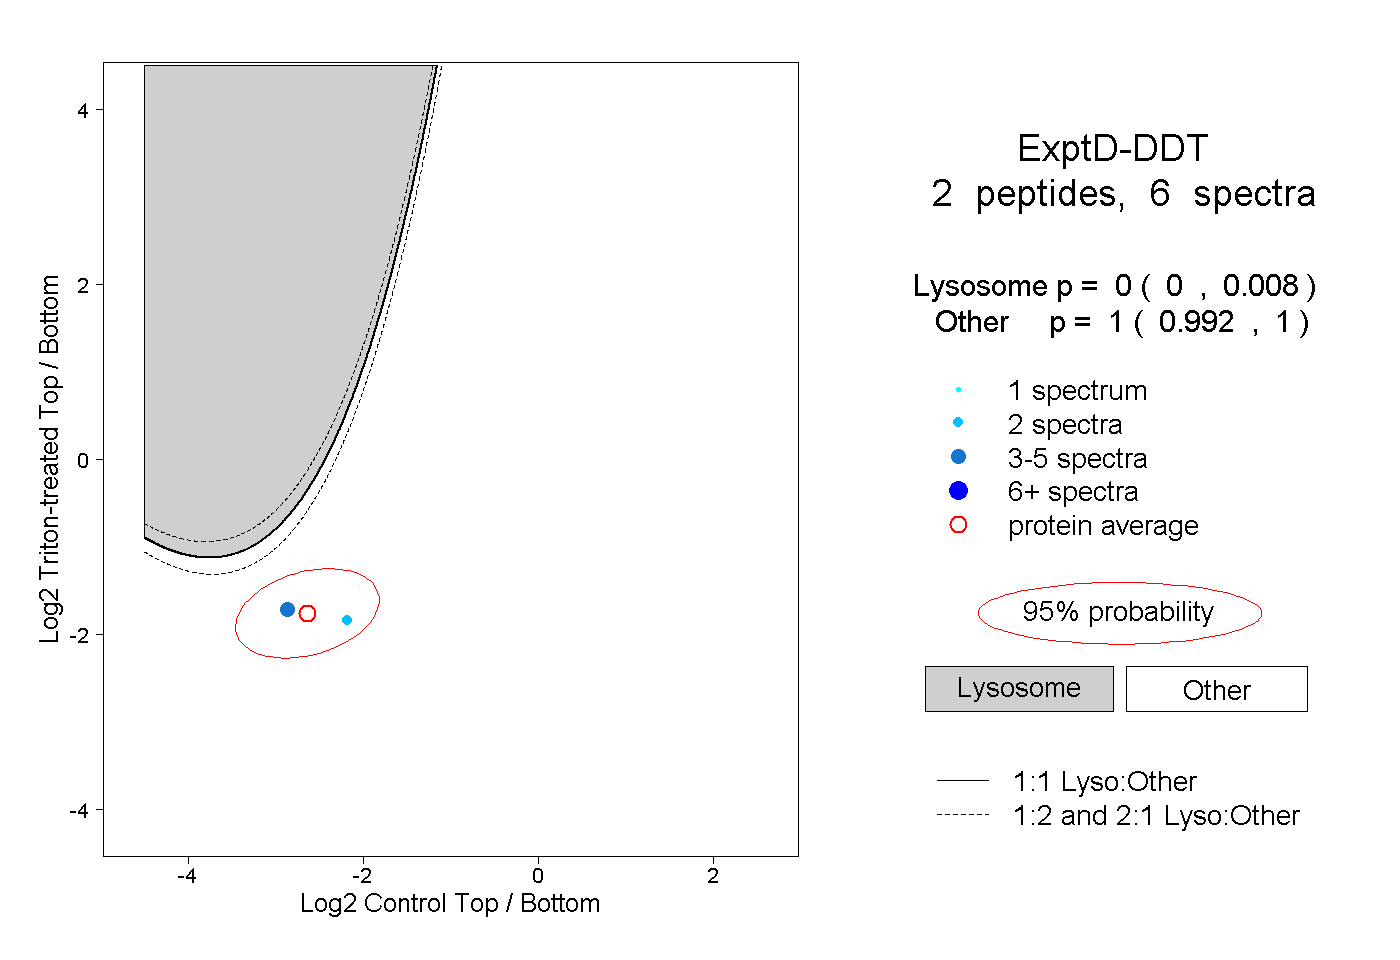
0.000 | 0.008
0.992 | 1.000