 6
6peptides
spectra

0.024 | 0.077
0.000 | 0.000
0.137 | 0.205
0.000 | 0.128
0.000 | 0.123
0.000 | 0.000
0.619 | 0.674
0.000 | 0.000
| Plot | Mito | Lyso | Perox | ER | Golgi | PM | Cytosol | Nucleus | |||||
| Expt A |
6 peptides |
15 spectra |
|
0.052 0.024 | 0.077 |
0.000 0.000 | 0.000 |
0.172 0.137 | 0.205 |
0.066 0.000 | 0.128 |
0.060 0.000 | 0.123 |
0.000 0.000 | 0.000 |
0.650 0.619 | 0.674 |
0.000 0.000 | 0.000 |
| 2 spectra, VSVTIRPGMTLLMNK | 0.000 | 0.114 | 0.000 | 0.000 | 0.061 | 0.000 | 0.825 | 0.000 | ||
| 7 spectra, FFPLEPWQIGK | 0.000 | 0.000 | 0.146 | 0.000 | 0.199 | 0.021 | 0.634 | 0.000 | ||
| 1 spectrum, LCAATATILDKPEDR | 0.019 | 0.015 | 0.100 | 0.000 | 0.017 | 0.000 | 0.850 | 0.000 | ||
| 1 spectrum, GTVMTFL | 0.347 | 0.000 | 0.103 | 0.000 | 0.000 | 0.064 | 0.486 | 0.000 | ||
| 3 spectra, STEPCAHLLISSIGVVGTAEQNR | 0.177 | 0.000 | 0.234 | 0.027 | 0.000 | 0.000 | 0.562 | 0.000 | ||
| 1 spectrum, IPAGLENR | 0.375 | 0.000 | 0.143 | 0.093 | 0.000 | 0.000 | 0.389 | 0.000 |
| Plot | Mito | Lyso or Perox | ER | Golgi | PM | Cytosol | Nucleus | ||||||
| Expt B |
7 peptides |
49 spectra |
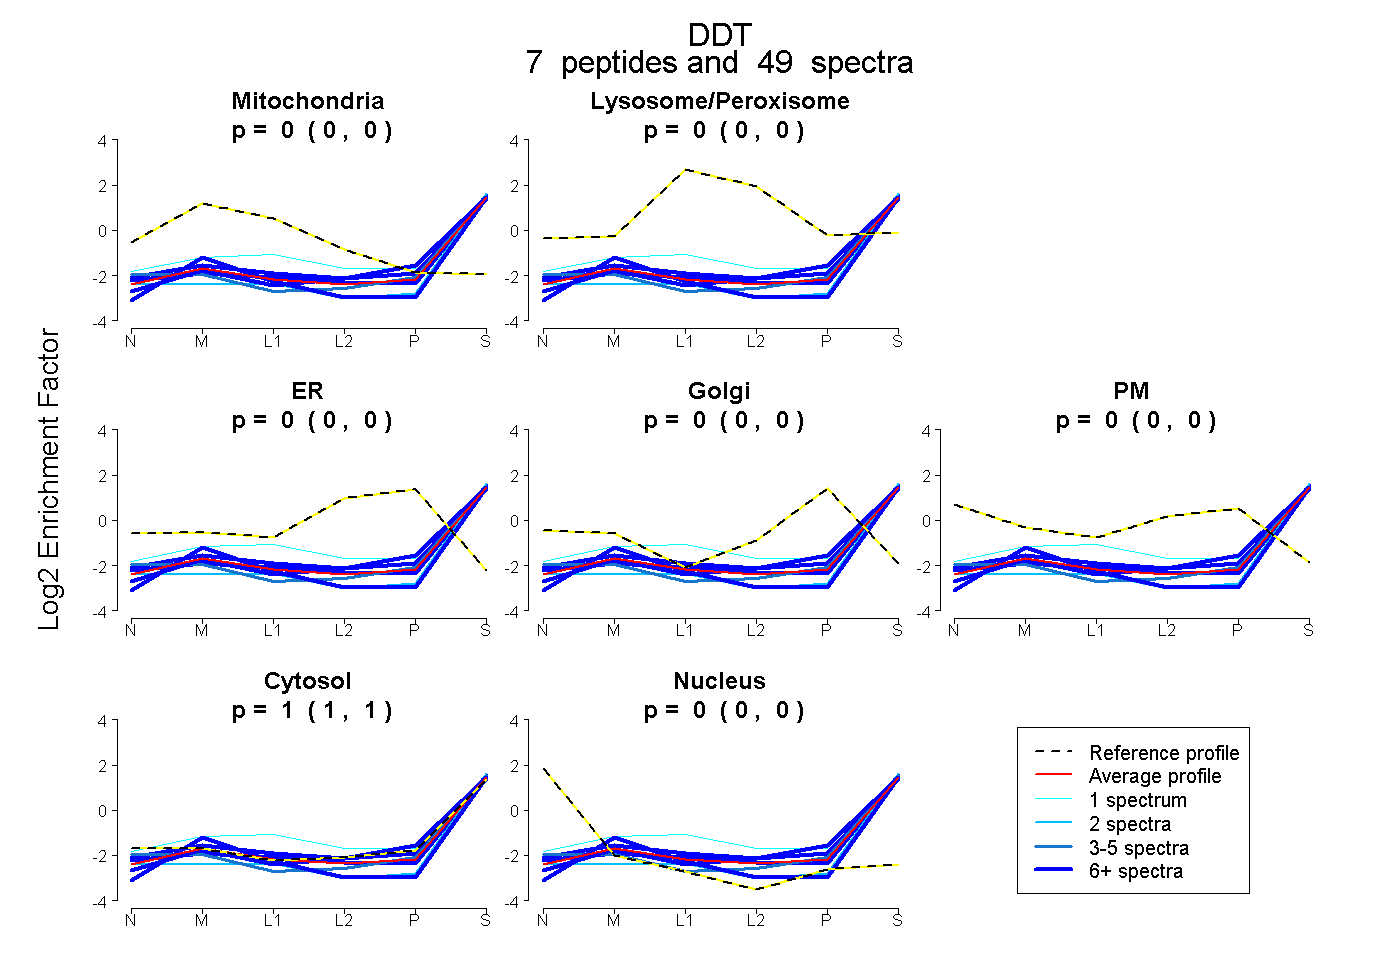 |
0.000 0.000 | 0.000 |
0.000 0.000 | 0.000 |
0.000 0.000 | 0.000 |
0.000 0.000 | 0.000 |
0.000 0.000 | 0.000 |
1.000 1.000 | 1.000 |
0.000 0.000 | 0.000 |
|||
| Plot | Lyso | Other | |||||||||||
| Expt C |
7 peptides |
136 spectra |
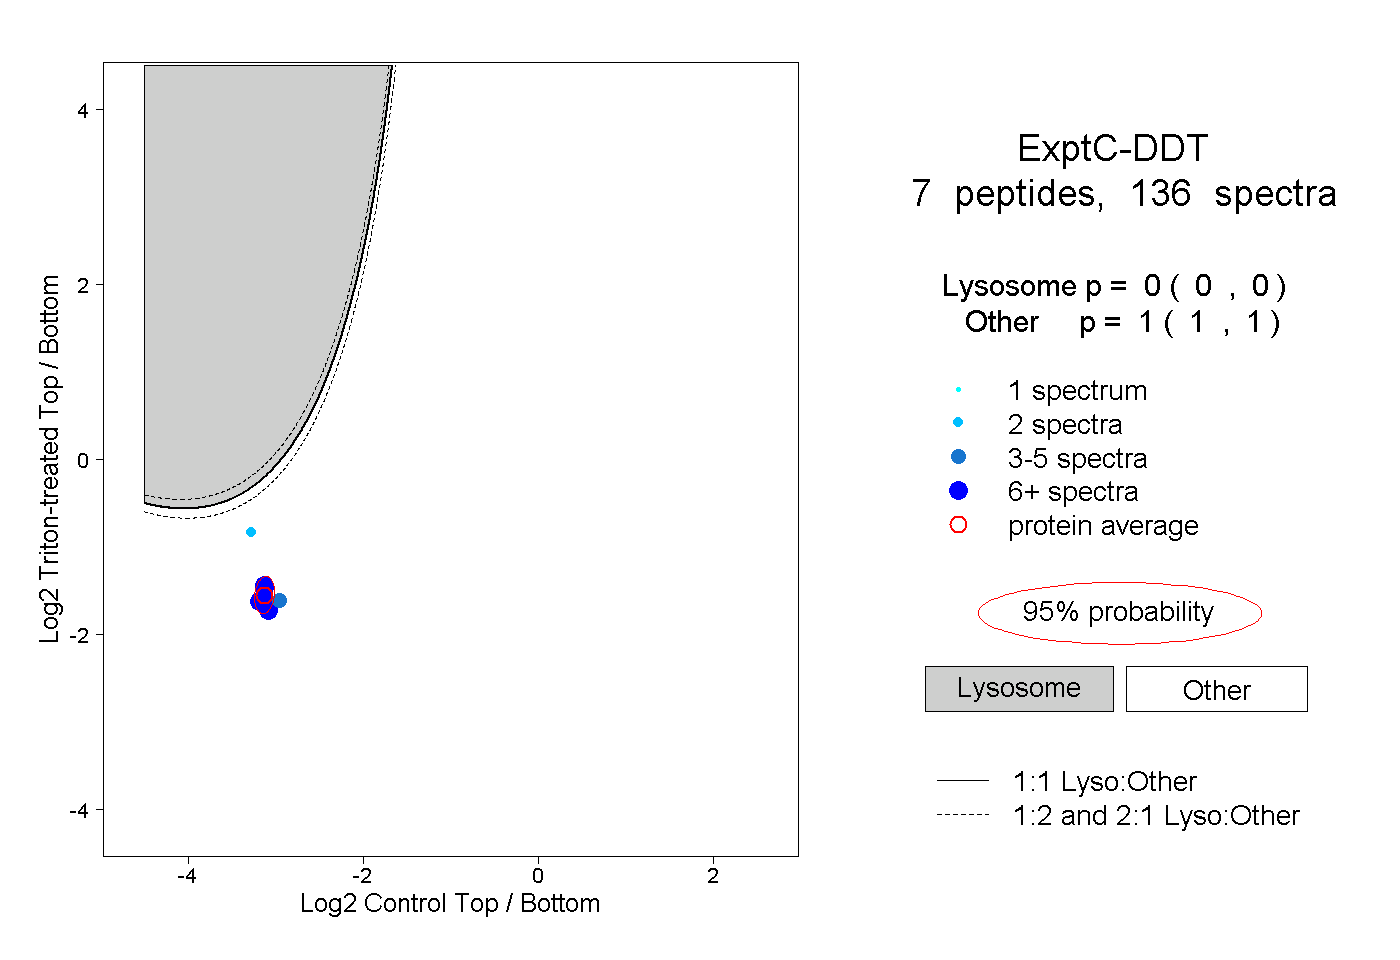 |
0.000 0.000 | 0.000 |
1.000 1.000 | 1.000 |
||||||||
| Plot | Lyso | Other | |||||||||||
| Expt D |
2 peptides |
6 spectra |
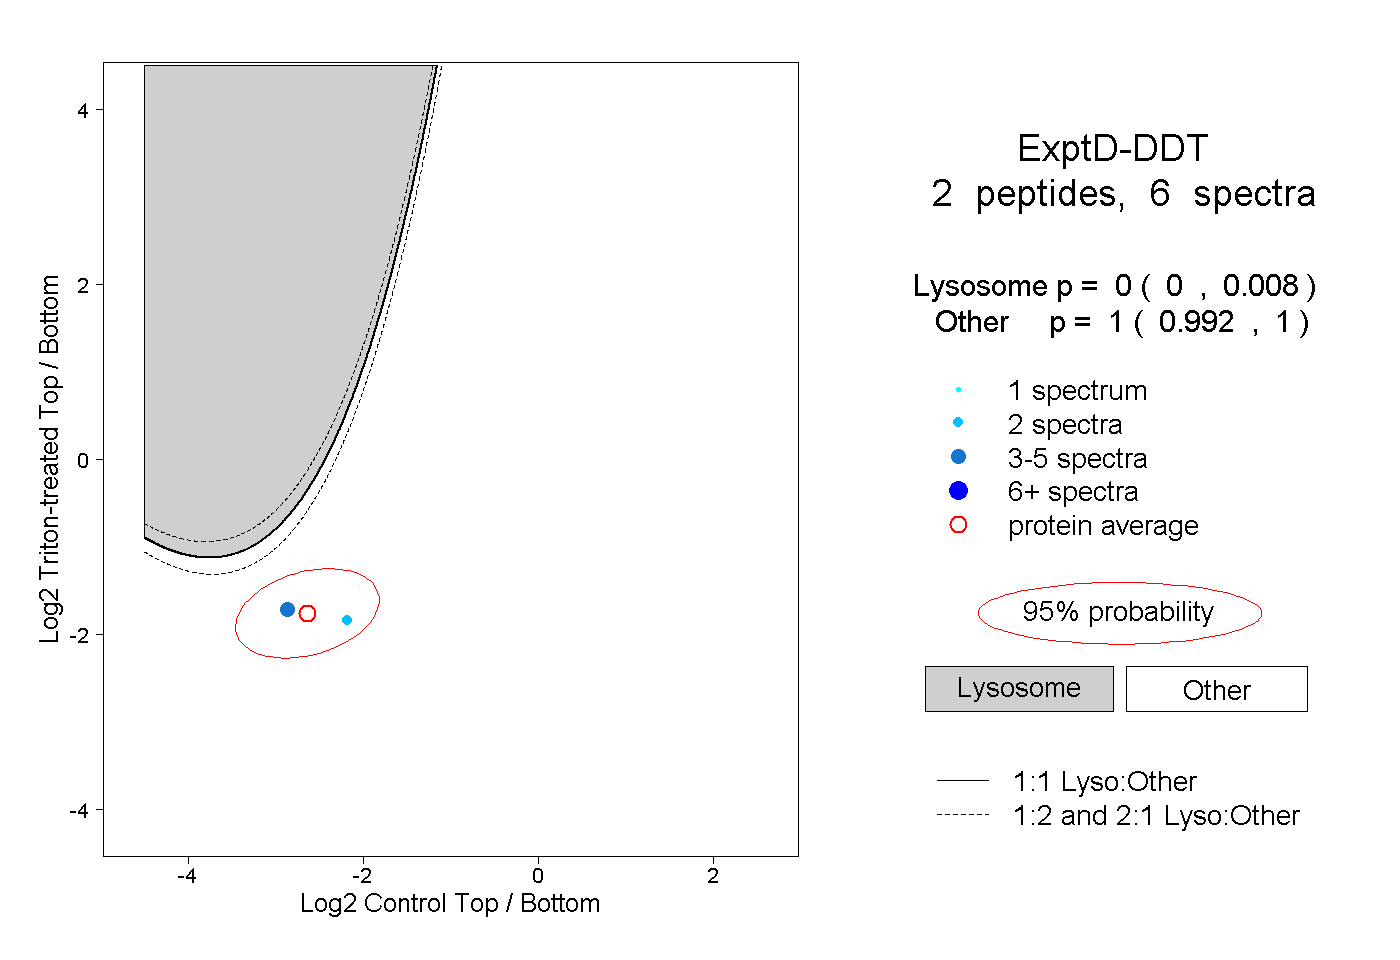 |
0.000 0.000 | 0.008 |
1.000 0.992 | 1.000 |