 5
5peptides
spectra
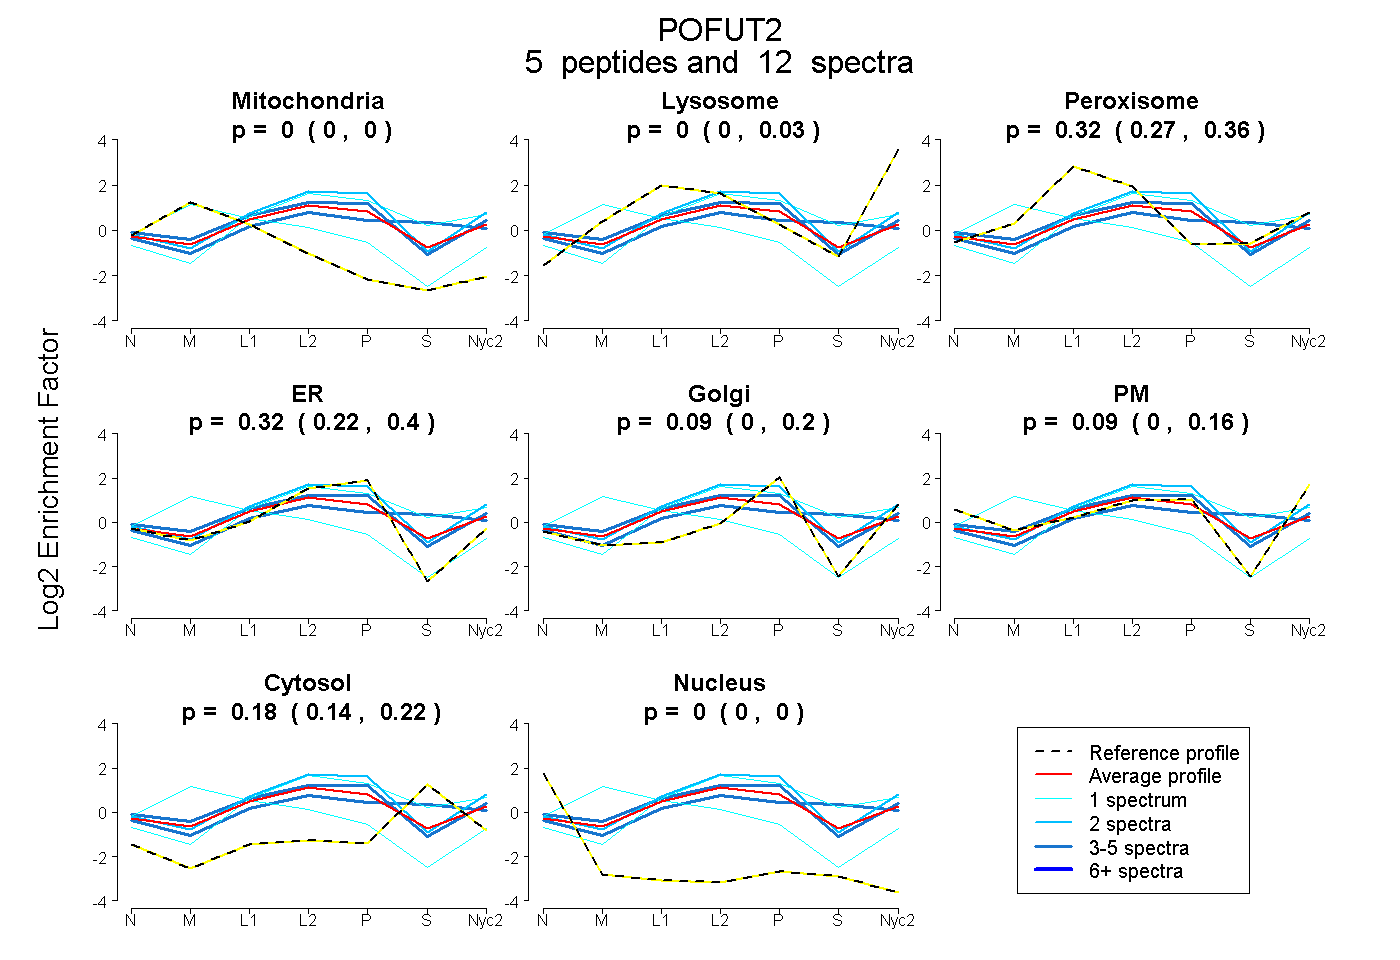
0.000 | 0.000
0.000 | 0.025
0.266 | 0.360
0.225 | 0.397
0.000 | 0.201
0.000 | 0.165
0.136 | 0.217
0.000 | 0.000
2peptides
spectra
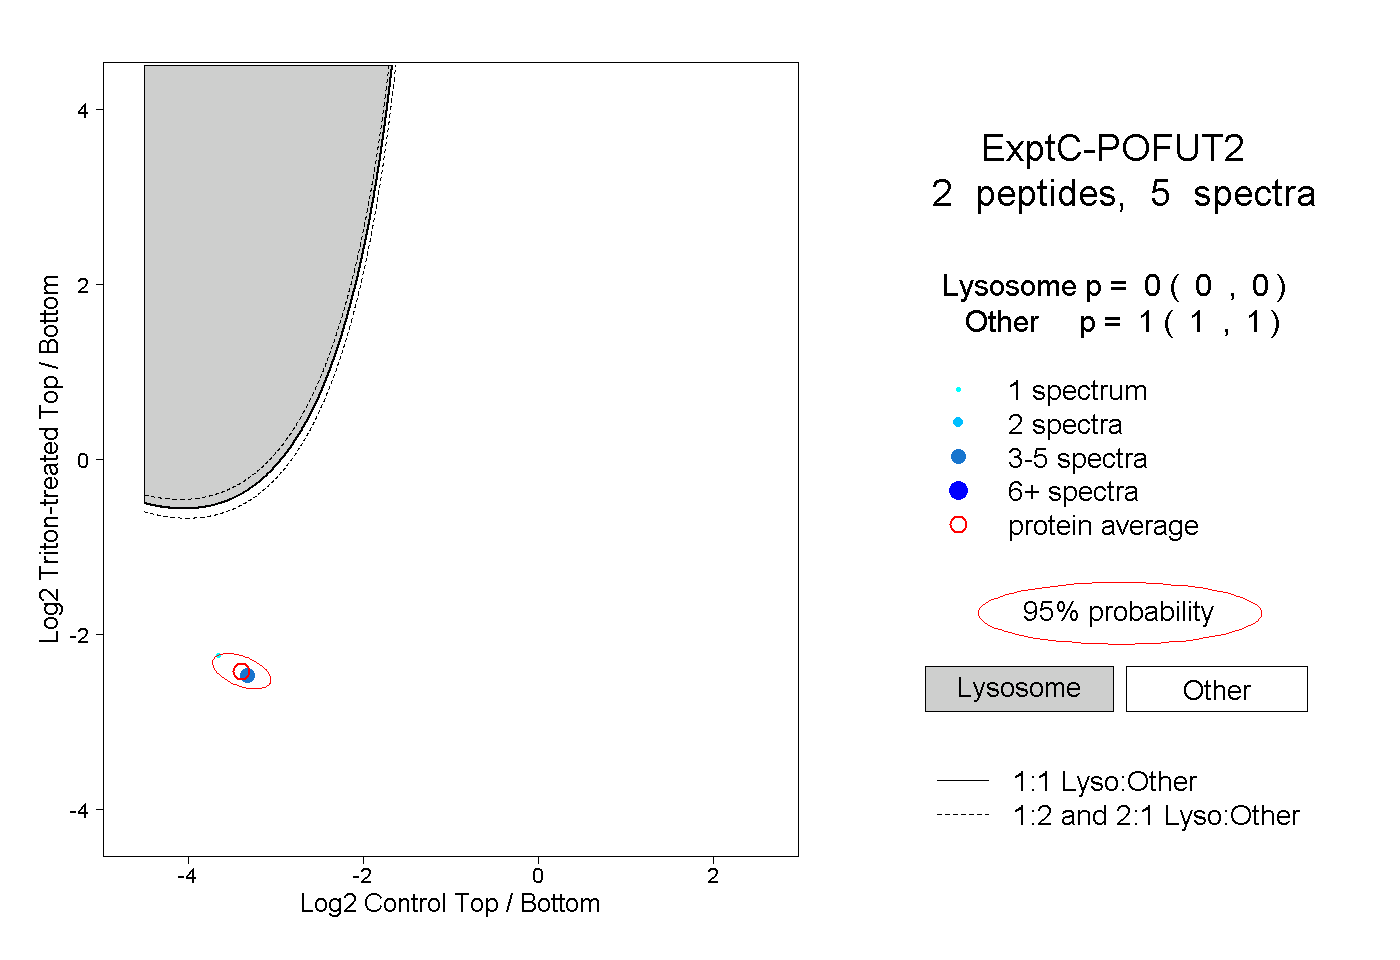
0.000 | 0.000
1.000 | 1.000
1peptide
spectrum
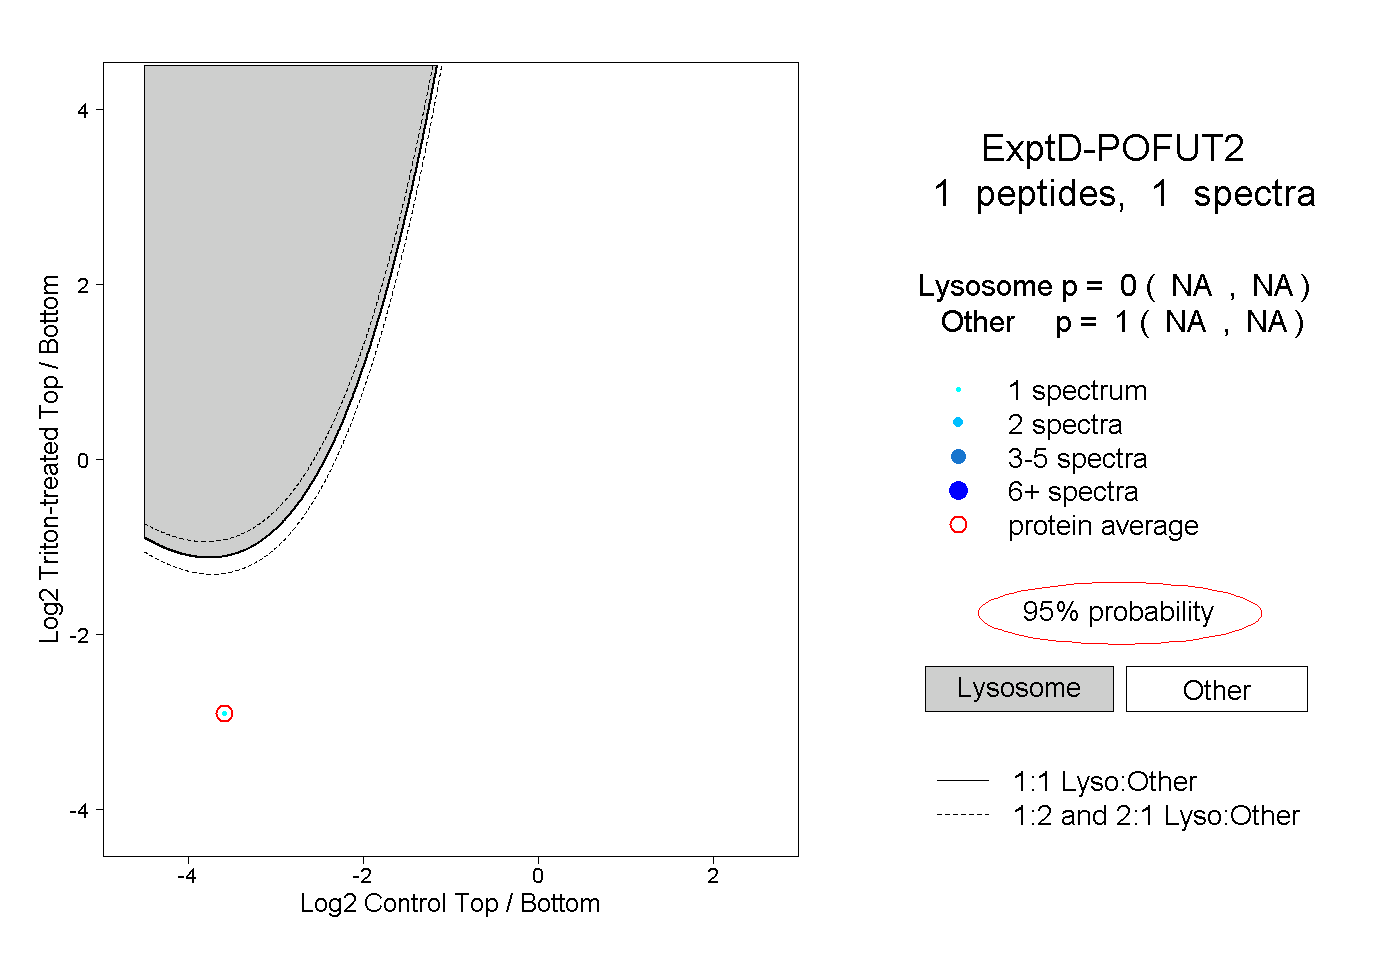
NA | NA
NA | NA