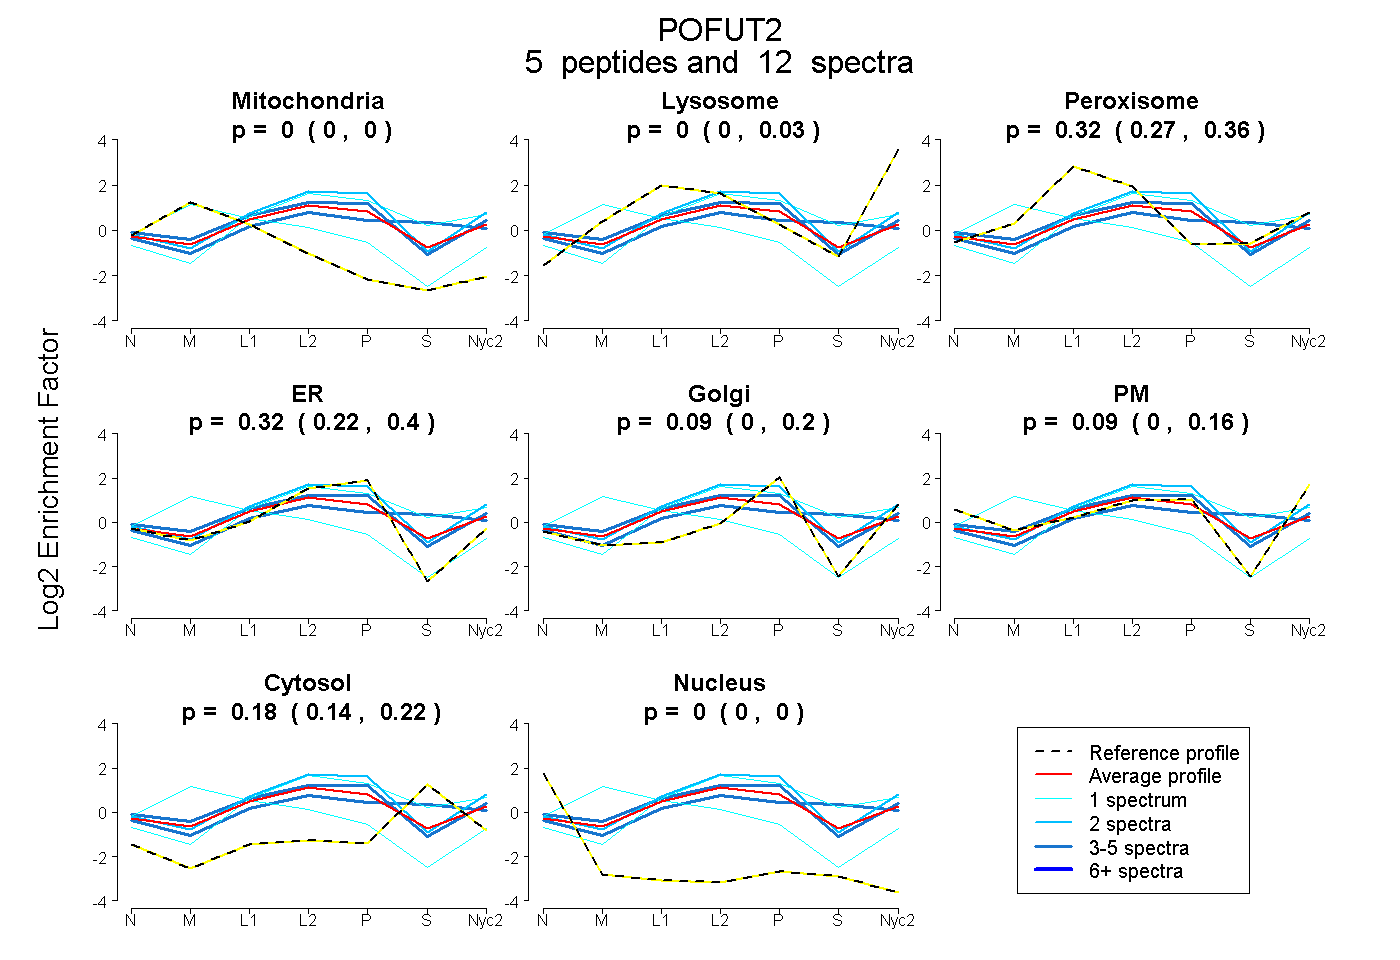
 5
5peptides
spectra
0.000 | 0.000
0.000 | 0.025
0.266 | 0.360
0.225 | 0.397
0.000 | 0.201
0.000 | 0.165
0.136 | 0.217
0.000 | 0.000
| Plot | Mito | Lyso | Perox | ER | Golgi | PM | Cytosol | Nucleus | |||||
| Expt A |
5 peptides |
12 spectra |
|
0.000 0.000 | 0.000 |
0.000 0.000 | 0.025 |
0.317 0.266 | 0.360 |
0.319 0.225 | 0.397 |
0.087 0.000 | 0.201 |
0.094 0.000 | 0.165 |
0.182 0.136 | 0.217 |
0.000 0.000 | 0.000 |
| 1 spectrum, GWFWGYEETR | 0.584 | 0.106 | 0.024 | 0.200 | 0.000 | 0.086 | 0.000 | 0.000 | ||
| 4 spectra, AENLLHDHYGGR | 0.000 | 0.000 | 0.343 | 0.307 | 0.203 | 0.081 | 0.066 | 0.000 | ||
| 2 spectra, MVLEEDWTR | 0.000 | 0.193 | 0.145 | 0.550 | 0.000 | 0.034 | 0.078 | 0.000 | ||
| 1 spectrum, LLPEMVR | 0.000 | 0.202 | 0.166 | 0.375 | 0.000 | 0.000 | 0.256 | 0.000 | ||
| 4 spectra, AVGDEFR | 0.000 | 0.000 | 0.293 | 0.231 | 0.000 | 0.083 | 0.393 | 0.000 |
| Plot | Lyso | Other | |||||||||||
| Expt C |
2 peptides |
5 spectra |
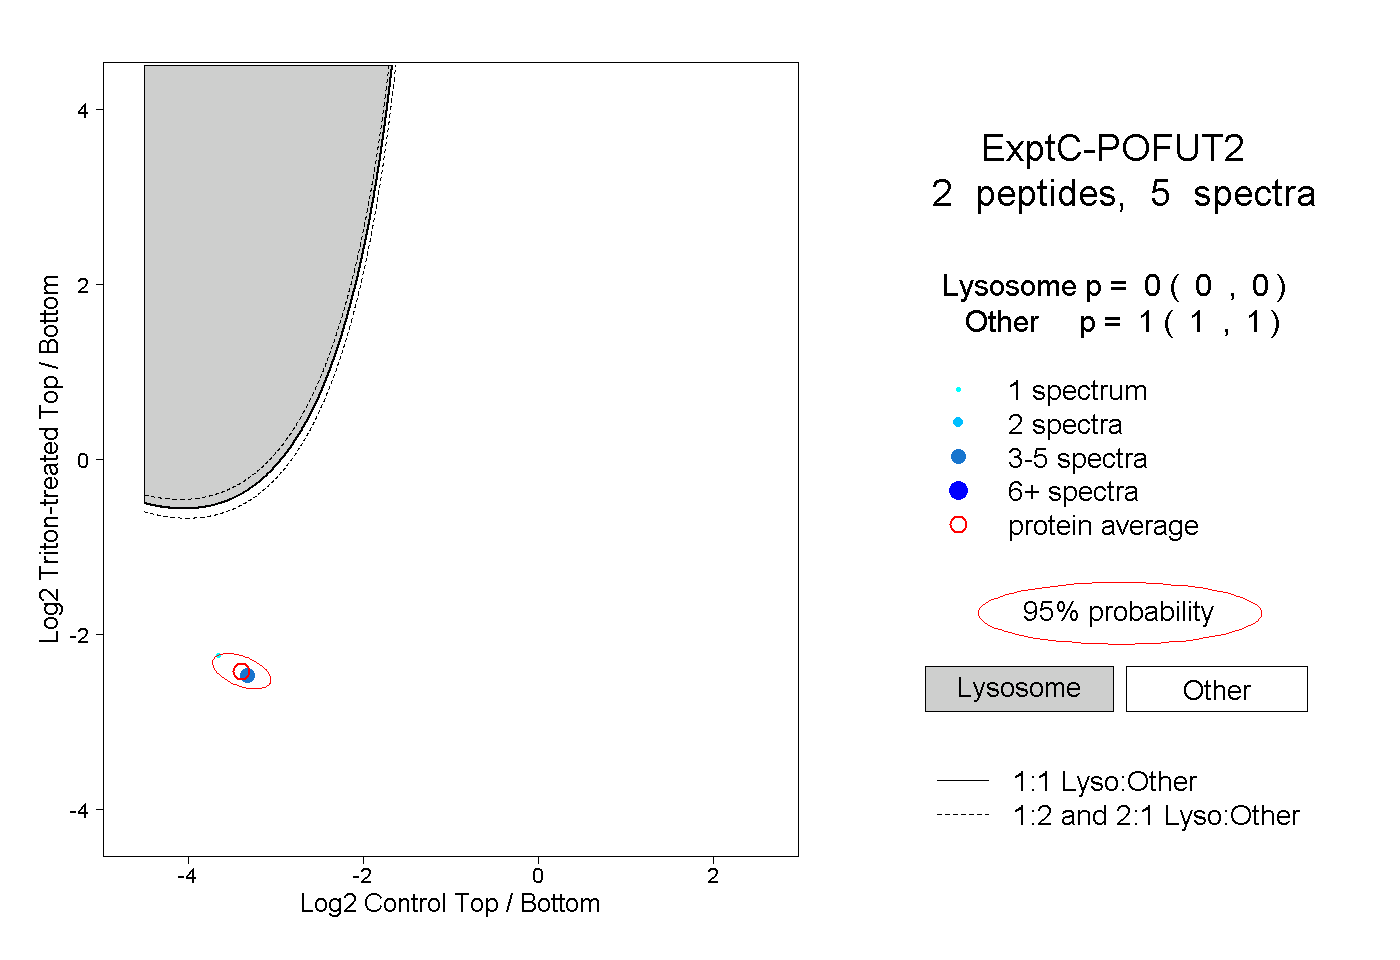 |
0.000 0.000 | 0.000 |
1.000 1.000 | 1.000 |
||||||||
| Plot | Lyso | Other | |||||||||||
| Expt D |
1 peptide |
1 spectrum |
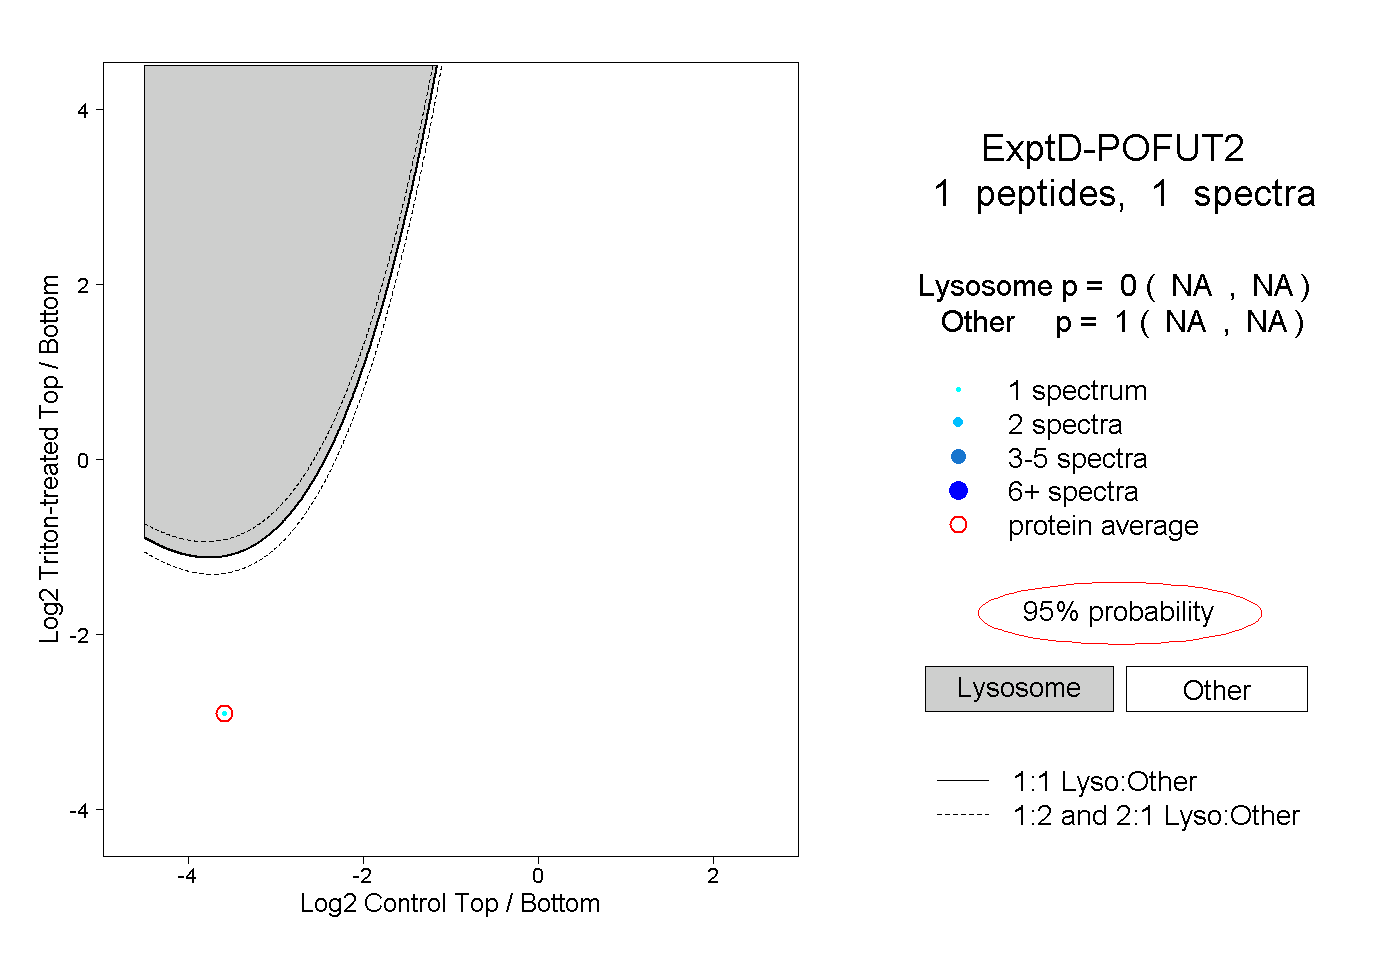 |
0.000 NA | NA |
1.000 NA | NA |