 6
6peptides
spectra
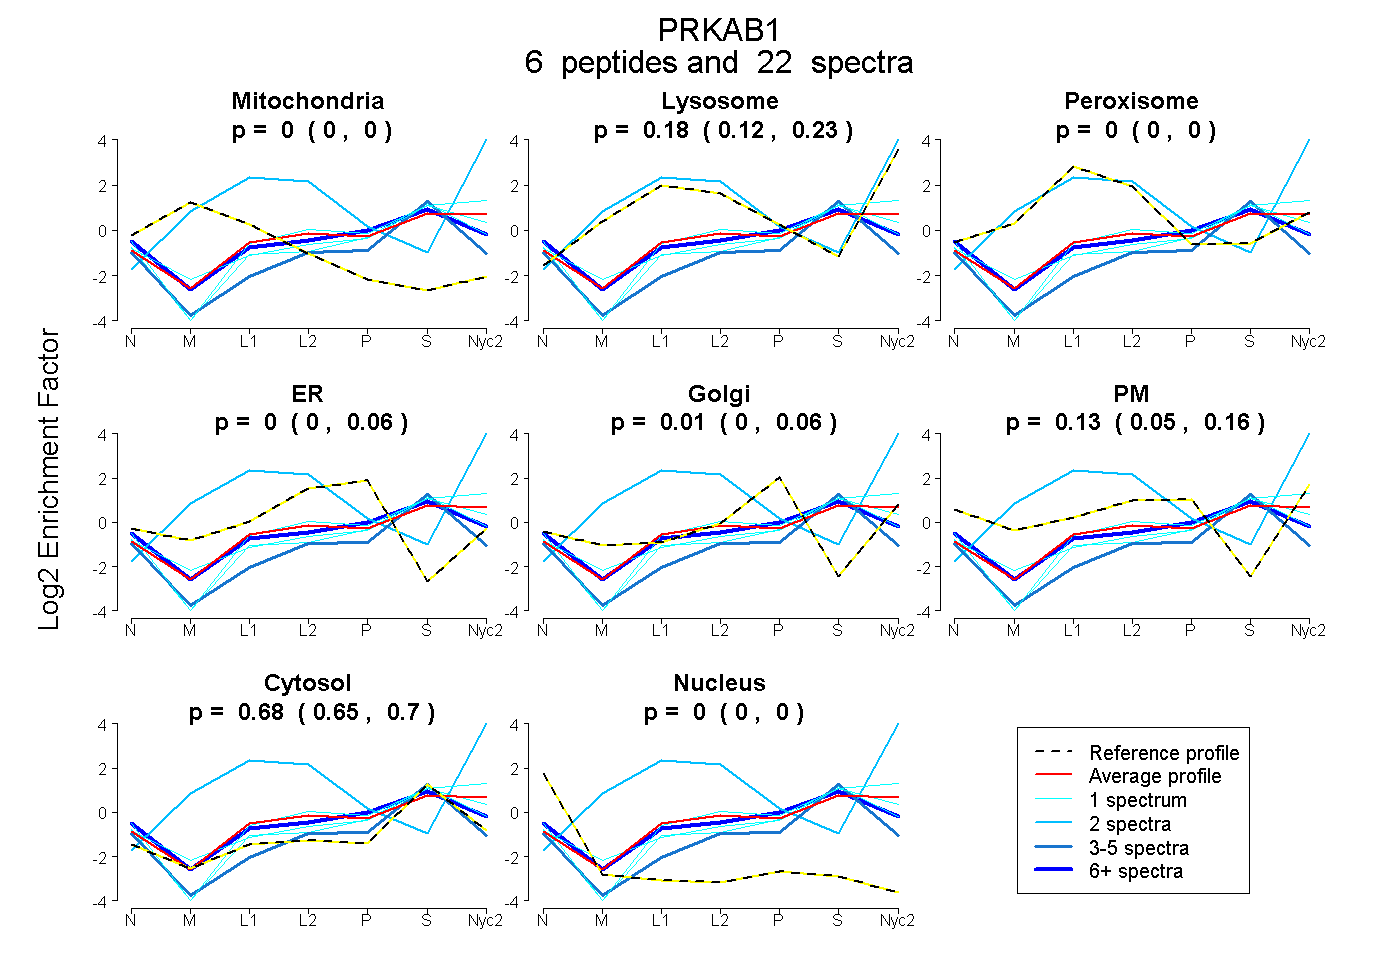
0.000 | 0.000
0.125 | 0.229
0.000 | 0.000
0.000 | 0.062
0.000 | 0.061
0.055 | 0.159
0.647 | 0.702
0.000 | 0.000
2peptides
spectra
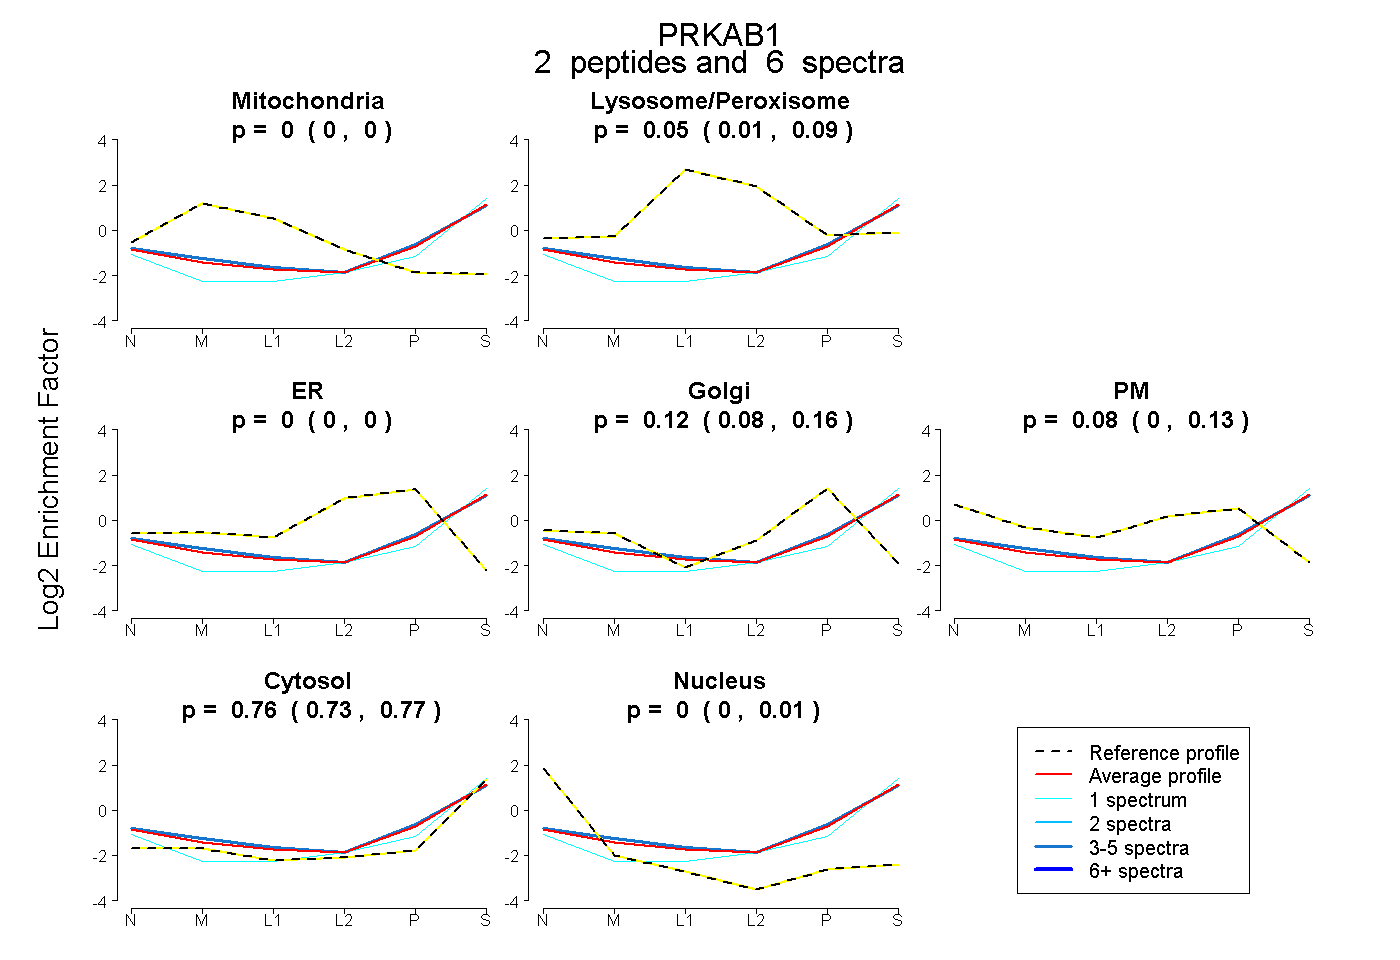
0.000 | 0.000
0.007 | 0.086
0.000 | 0.000
0.077 | 0.159
0.000 | 0.126
0.734 | 0.774
0.000 | 0.009
5peptides
spectra
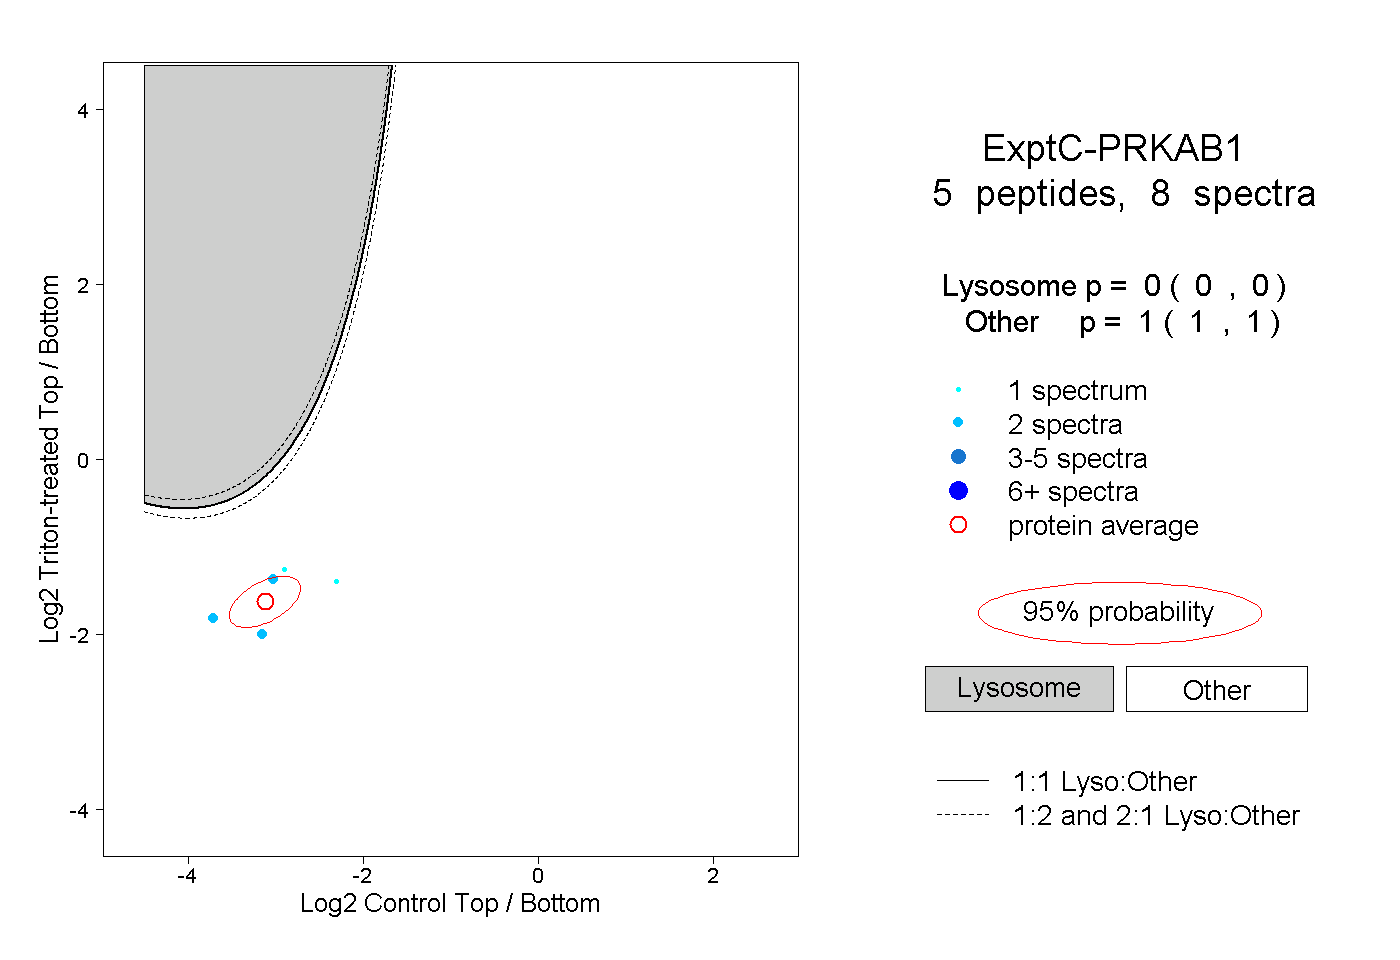
0.000 | 0.000
1.000 | 1.000
2peptides
spectra
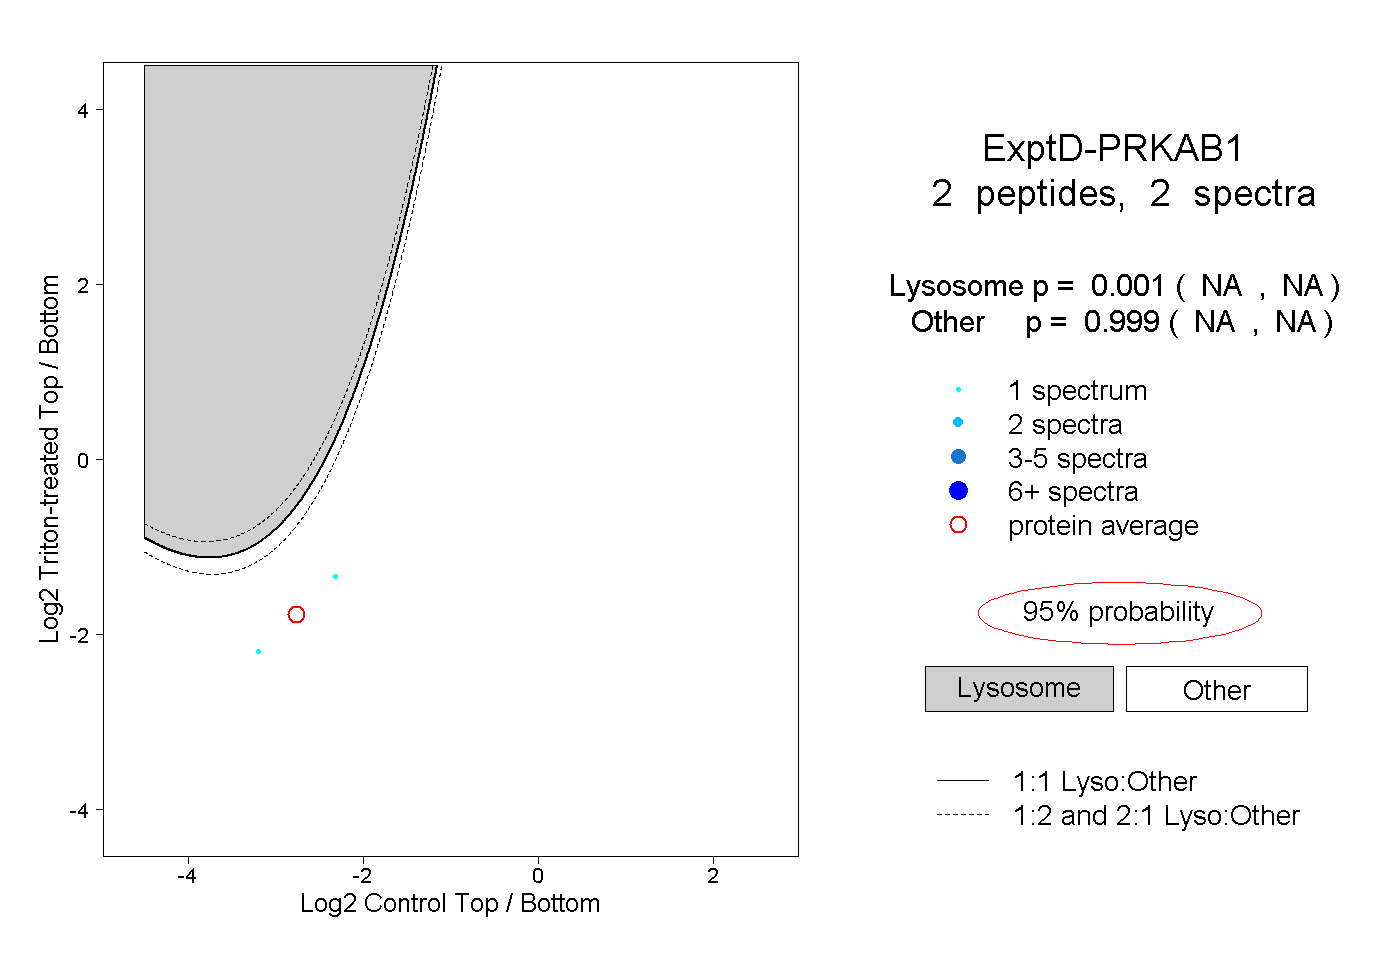
NA | NA
NA | NA