 6
6peptides
spectra
0.000 | 0.000
0.125 | 0.229
0.000 | 0.000
0.000 | 0.062
0.000 | 0.061
0.055 | 0.159
0.647 | 0.702
0.000 | 0.000
| Plot | Mito | Lyso | Perox | ER | Golgi | PM | Cytosol | Nucleus | |||||
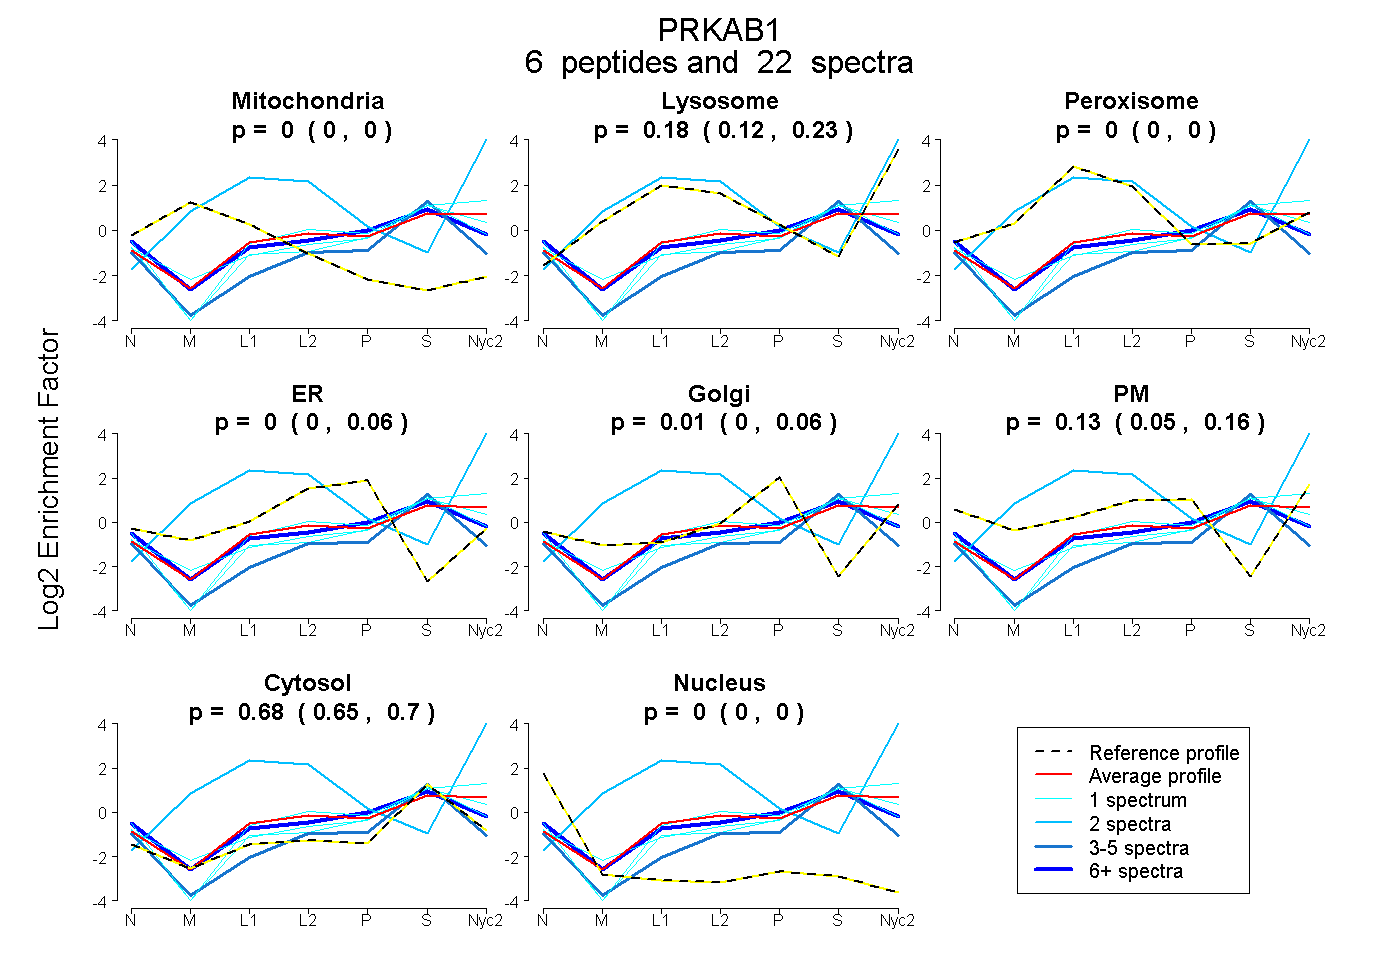
| Expt A |
6 peptides |
22 spectra |
|
0.000 0.000 | 0.000 |
0.177 0.125 | 0.229 |
0.000 0.000 | 0.000 |
0.000 0.000 | 0.062 |
0.010 0.000 | 0.061 |
0.135 0.055 | 0.159 |
0.678 0.647 | 0.702 |
0.000 0.000 | 0.000 |
| 3 spectra, ILMDSPEDADIFHTEEMK | 0.000 | 0.000 | 0.000 | 0.000 | 0.000 | 0.000 | 0.951 | 0.049 | ||
| 1 spectrum, YVTTLLYKPI | 0.000 | 0.143 | 0.000 | 0.000 | 0.000 | 0.145 | 0.713 | 0.000 | ||
| 14 spectra, APAQARPTVFR | 0.000 | 0.000 | 0.000 | 0.100 | 0.000 | 0.166 | 0.734 | 0.000 | ||
| 1 spectrum, DGDRPK | 0.000 | 0.000 | 0.000 | 0.000 | 0.127 | 0.000 | 0.873 | 0.000 | ||
| 2 spectra, DSSGGTK | 0.000 | 1.000 | 0.000 | 0.000 | 0.000 | 0.000 | 0.000 | 0.000 | ||
| 1 spectrum, WTGGGK | 0.000 | 0.093 | 0.000 | 0.000 | 0.050 | 0.103 | 0.754 | 0.000 |
| Plot | Mito | Lyso or Perox | ER | Golgi | PM | Cytosol | Nucleus | ||||||
| Expt B |
2 peptides |
6 spectra |
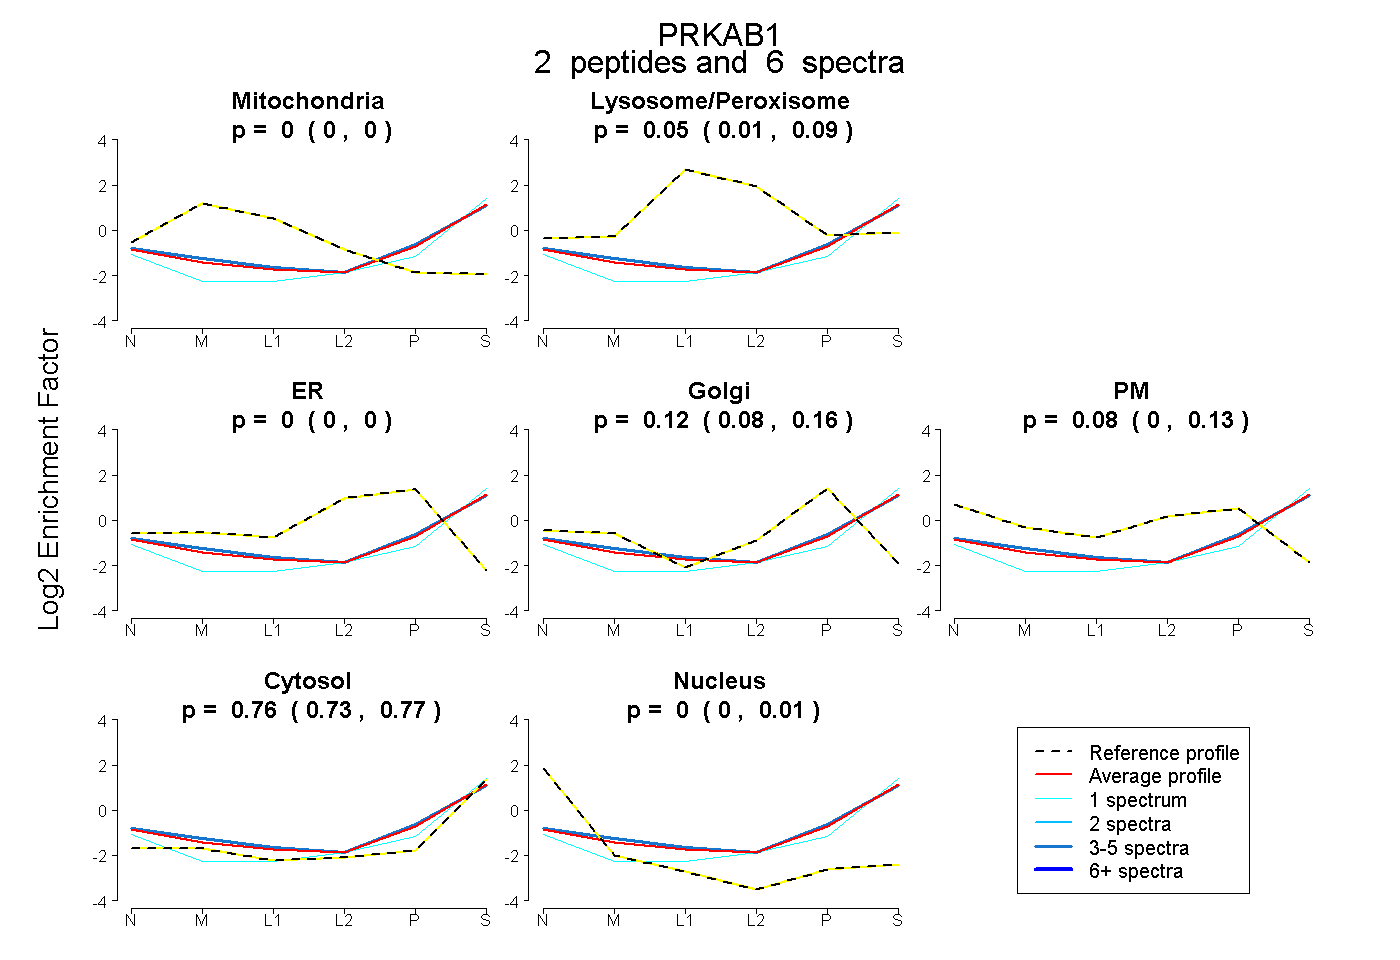 |
0.000 0.000 | 0.000 |
0.047 0.007 | 0.086 |
0.000 0.000 | 0.000 |
0.121 0.077 | 0.159 |
0.075 0.000 | 0.126 |
0.757 0.734 | 0.774 |
0.000 0.000 | 0.009 |
|||
| Plot | Lyso | Other | |||||||||||
| Expt C |
5 peptides |
8 spectra |
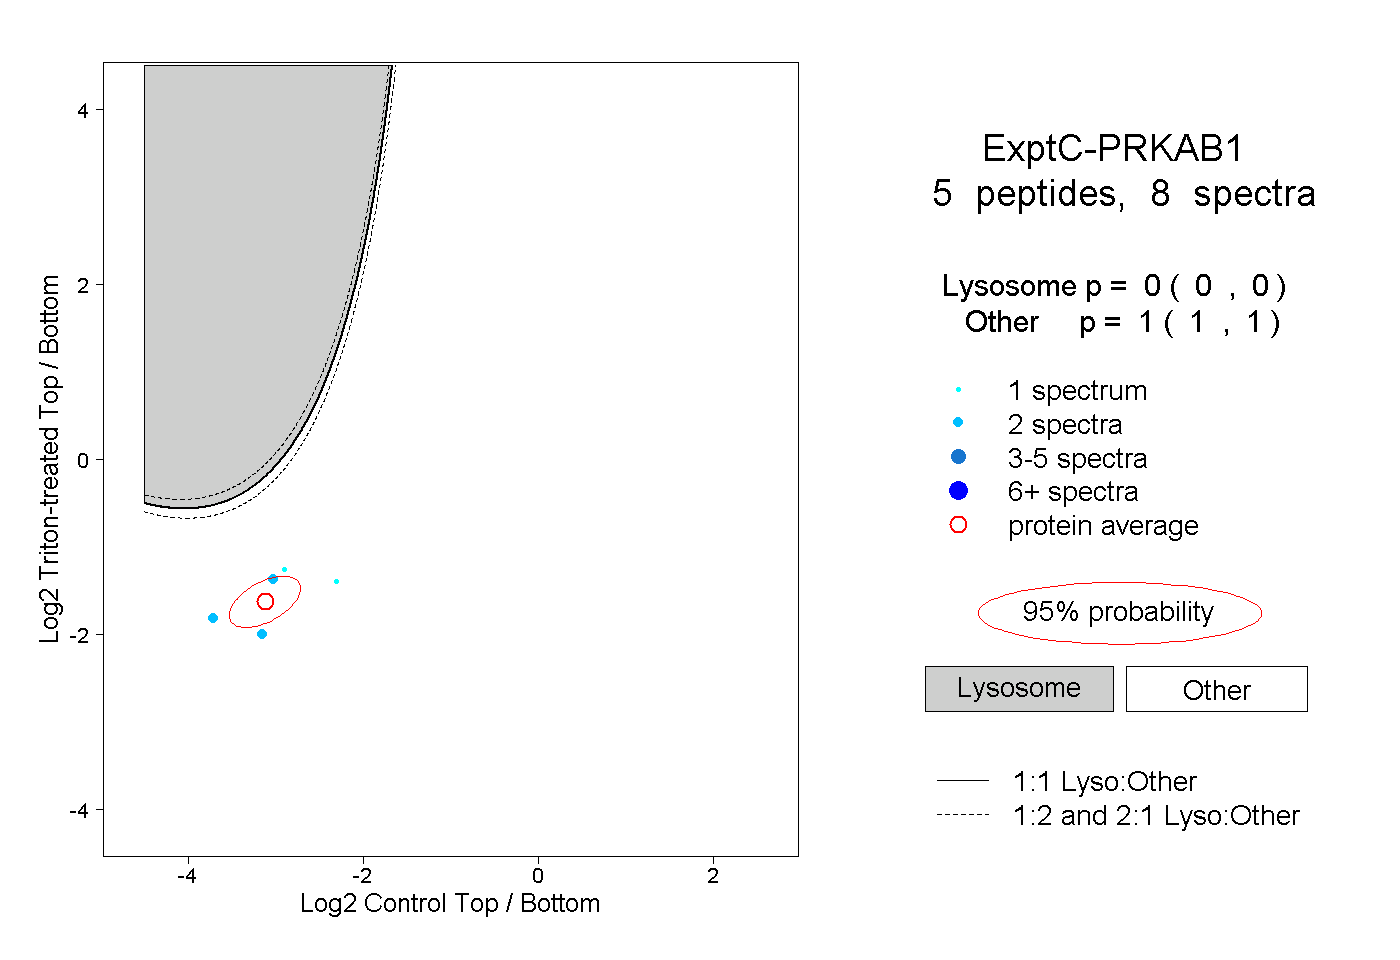 |
0.000 0.000 | 0.000 |
1.000 1.000 | 1.000 |
||||||||
| Plot | Lyso | Other | |||||||||||
| Expt D |
2 peptides |
2 spectra |
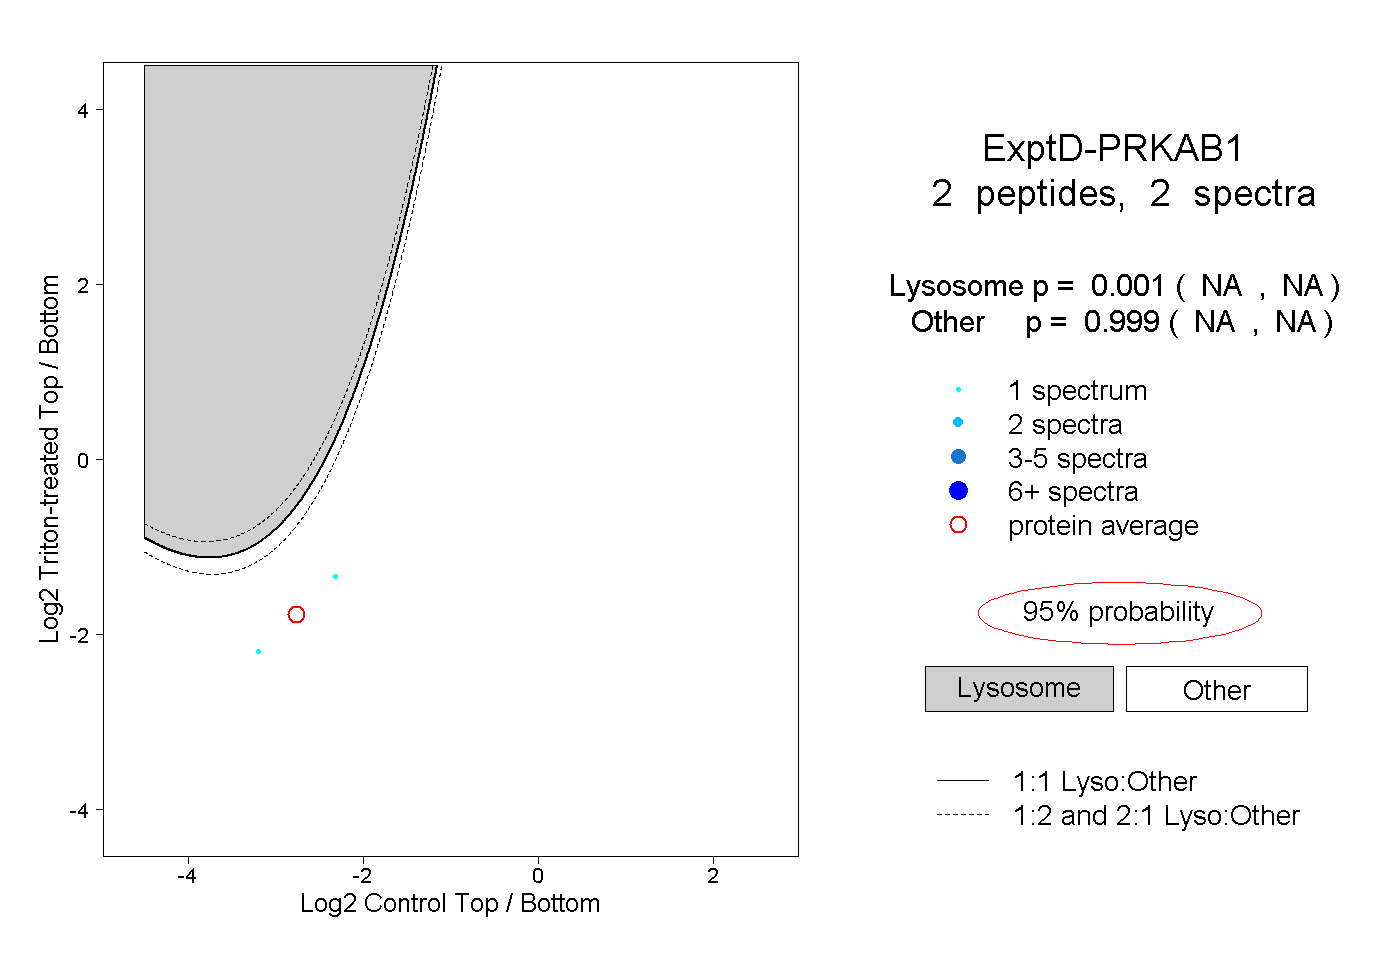 |
0.001 NA | NA |
0.999 NA | NA |