 8
8peptides
spectra
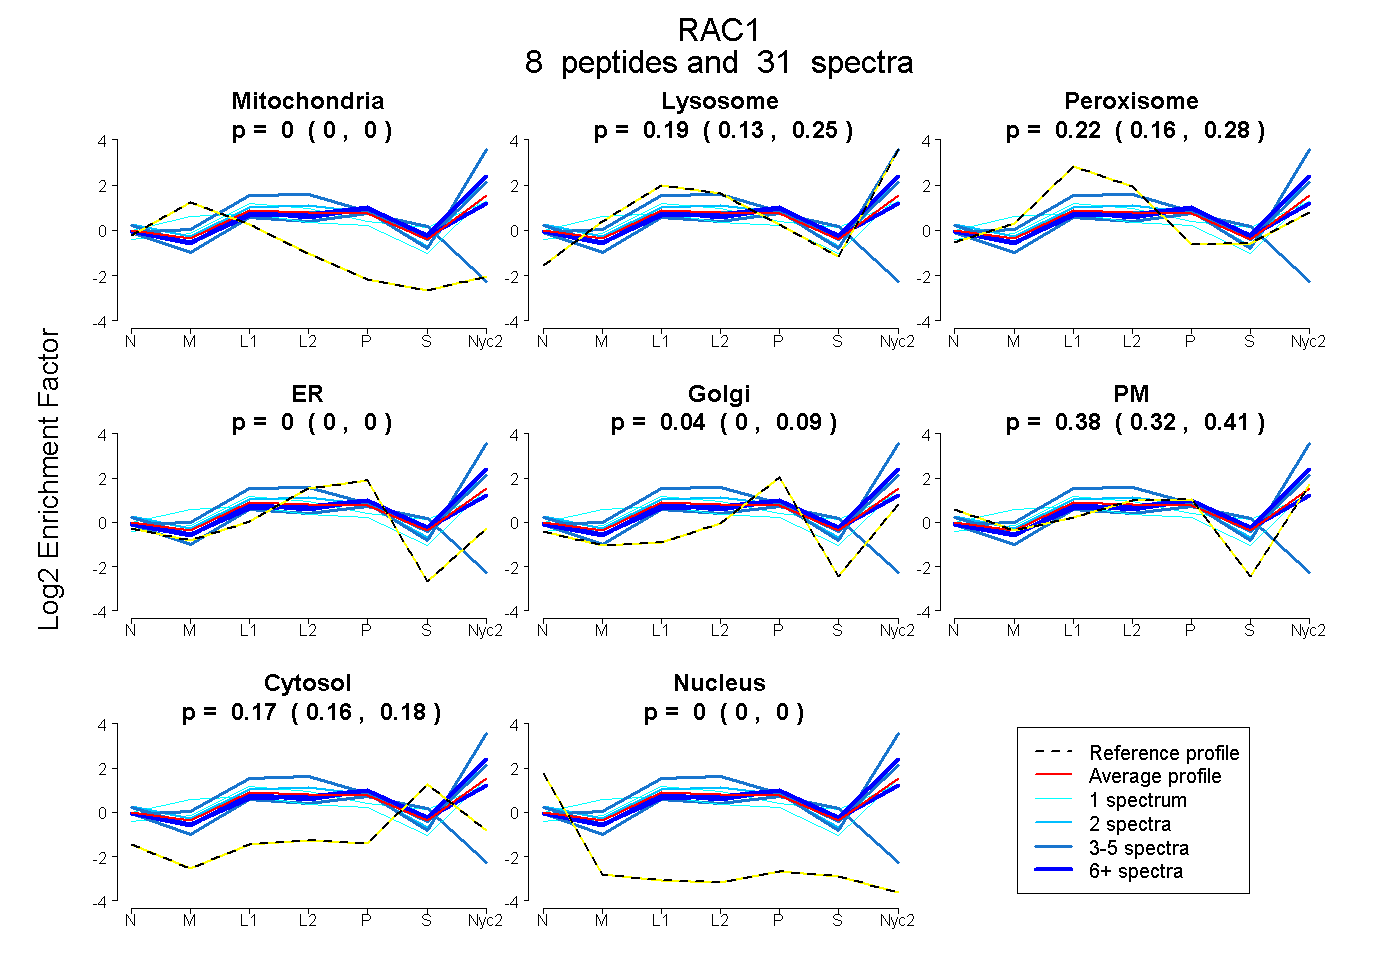
0.000 | 0.000
0.128 | 0.246
0.159 | 0.282
0.000 | 0.000
0.000 | 0.086
0.318 | 0.412
0.157 | 0.180
0.000 | 0.000
5peptides
spectra
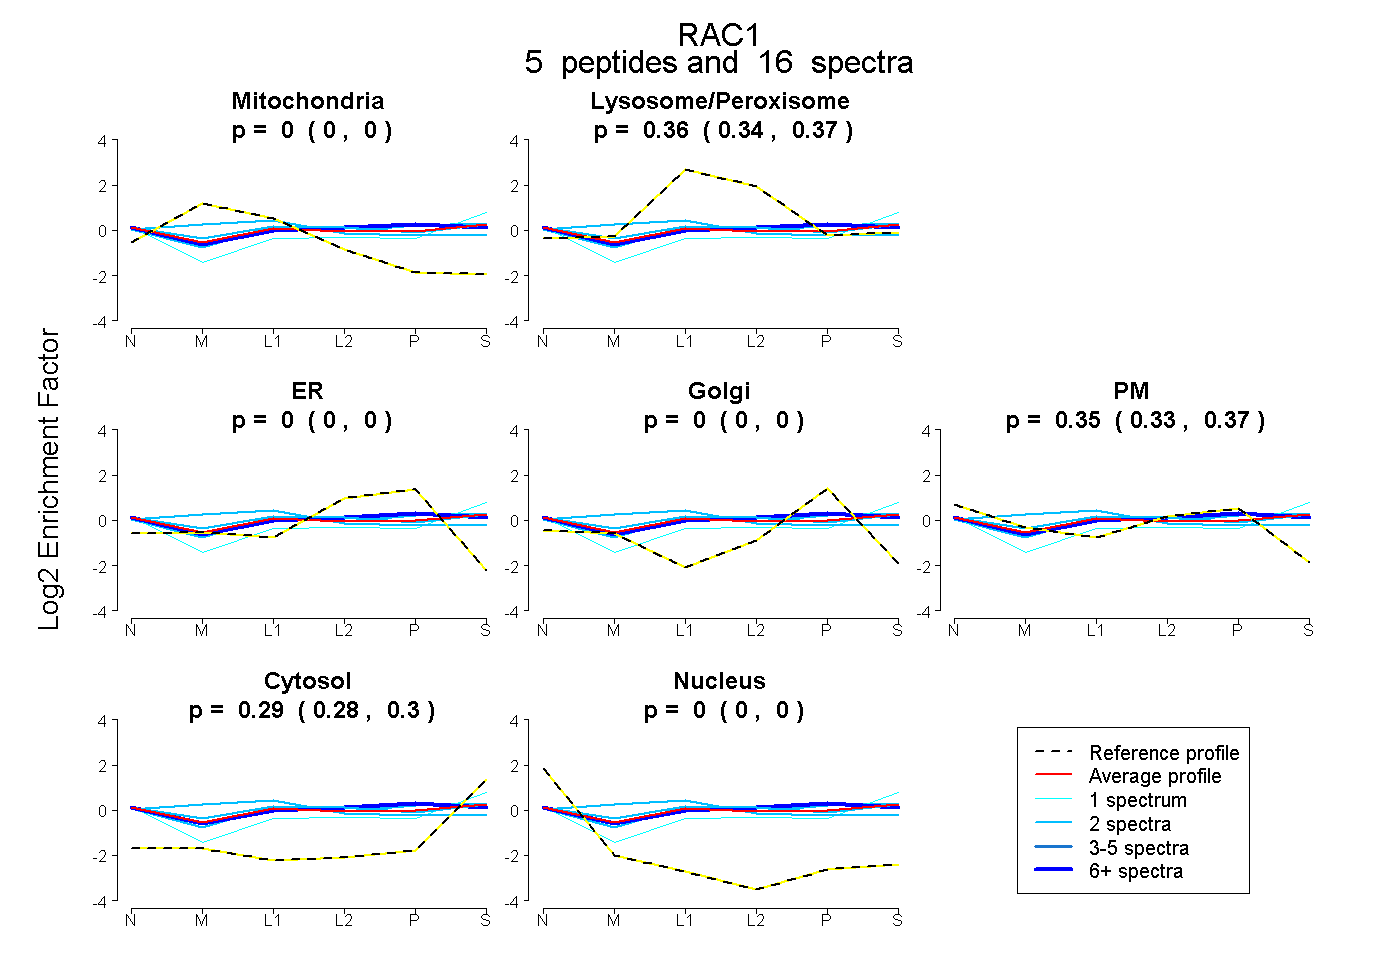
0.000 | 0.000
0.344 | 0.368
0.000 | 0.000
0.000 | 0.000
0.334 | 0.370
0.278 | 0.299
0.000 | 0.000
7peptides
spectra
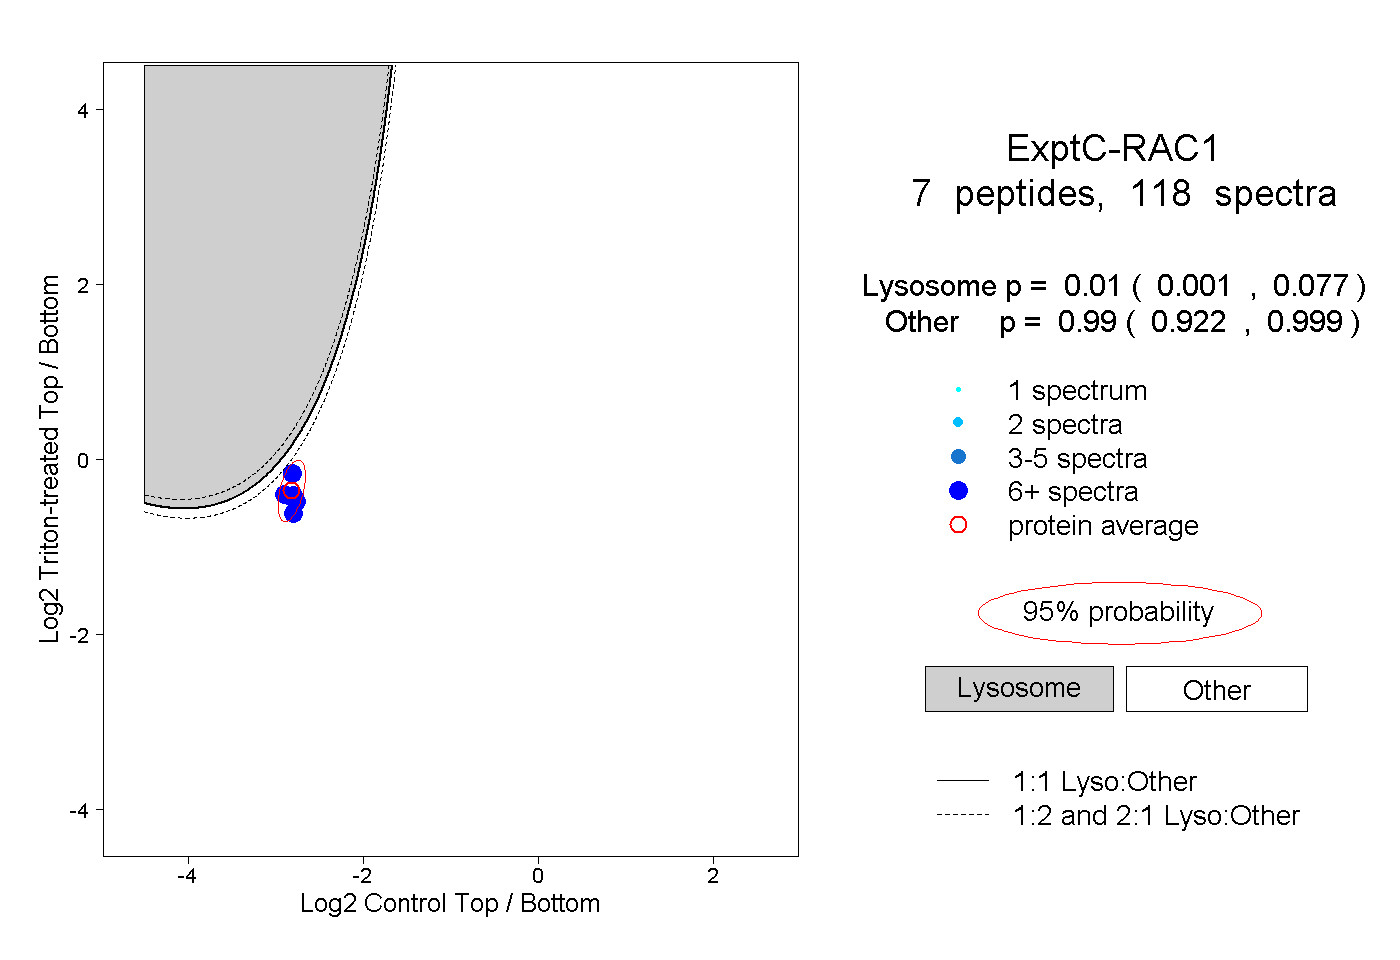
0.001 | 0.077
0.922 | 0.999
1peptide
spectrum
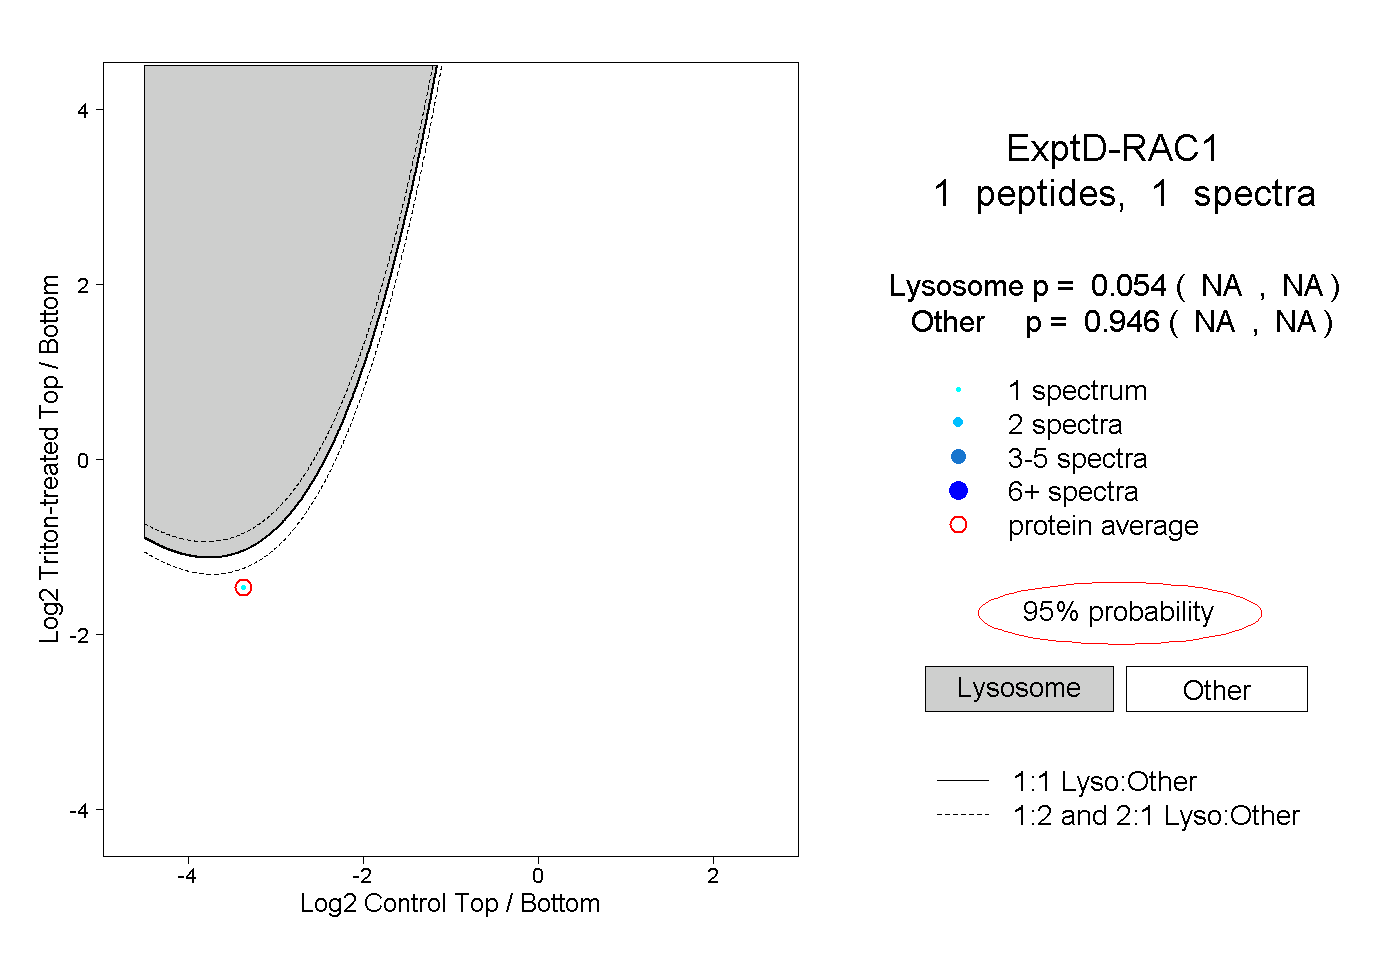
NA | NA
NA | NA