 8
8peptides
spectra
0.000 | 0.000
0.128 | 0.246
0.159 | 0.282
0.000 | 0.000
0.000 | 0.086
0.318 | 0.412
0.157 | 0.180
0.000 | 0.000
| Plot | Mito | Lyso | Perox | ER | Golgi | PM | Cytosol | Nucleus | |||||
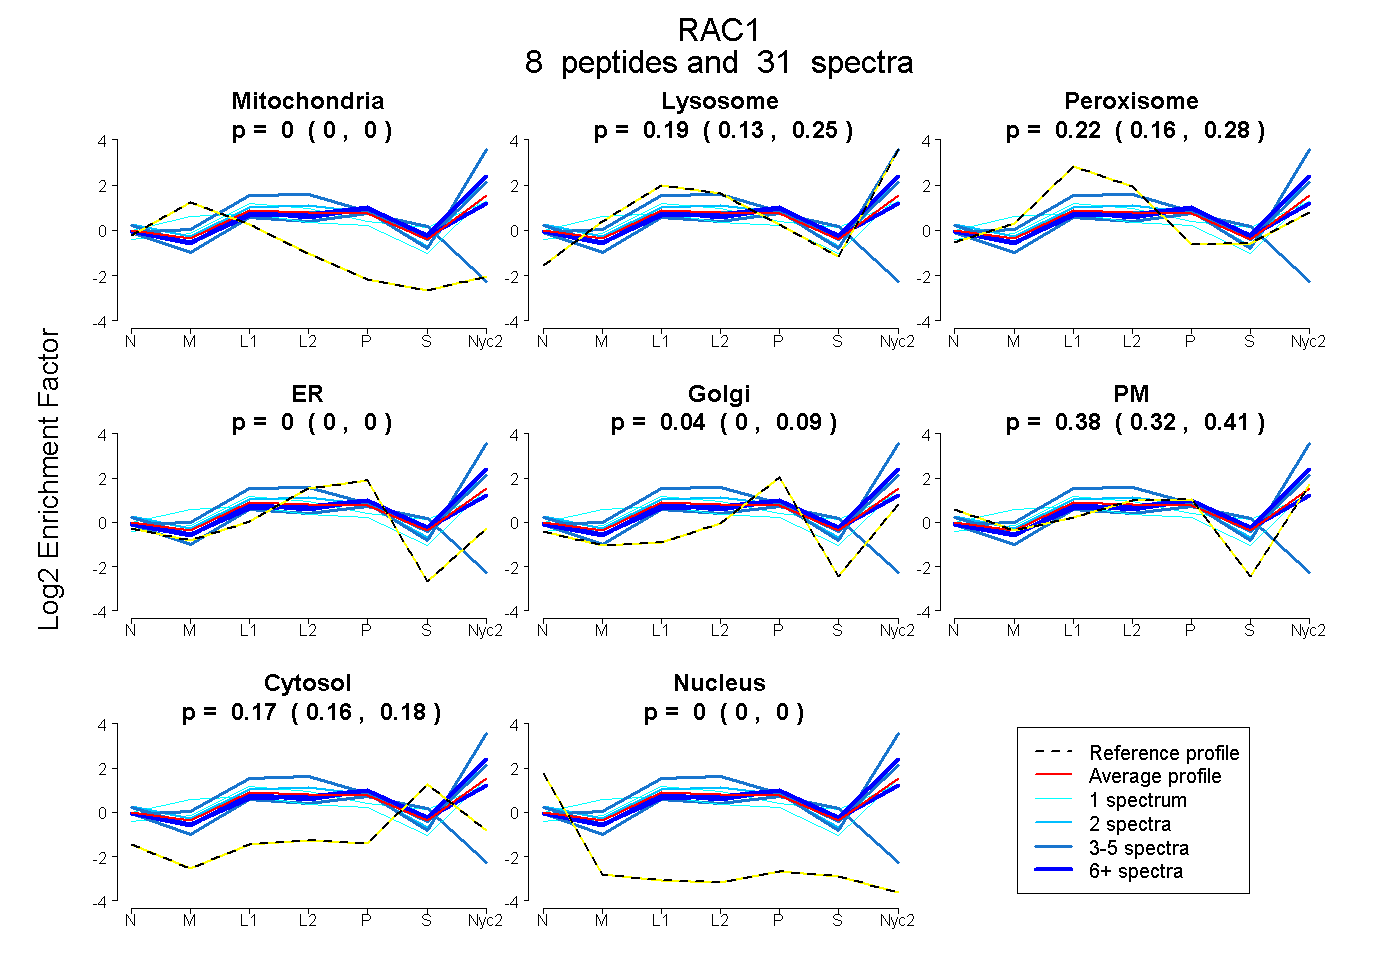
| Expt A |
8 peptides |
31 spectra |
|
0.000 0.000 | 0.000 |
0.195 0.128 | 0.246 |
0.222 0.159 | 0.282 |
0.000 0.000 | 0.000 |
0.036 0.000 | 0.086 |
0.377 0.318 | 0.412 |
0.171 0.157 | 0.180 |
0.000 0.000 | 0.000 |
| 3 spectra, LTPITYPQGLAMAK | 0.000 | 0.713 | 0.000 | 0.000 | 0.000 | 0.287 | 0.000 | 0.000 | ||
| 1 spectrum, AVLCPPPVK | 0.000 | 0.224 | 0.398 | 0.000 | 0.081 | 0.099 | 0.198 | 0.000 | ||
| 5 spectra, TVFDEAIR | 0.000 | 0.321 | 0.028 | 0.000 | 0.000 | 0.473 | 0.178 | 0.000 | ||
| 8 spectra, WYPEVR | 0.000 | 0.431 | 0.000 | 0.000 | 0.000 | 0.373 | 0.196 | 0.000 | ||
| 2 spectra, HHCPNTPIILVGTK | 0.000 | 0.355 | 0.090 | 0.000 | 0.000 | 0.476 | 0.080 | 0.000 | ||
| 4 spectra, CVVVGDGAVGK | 0.024 | 0.000 | 0.215 | 0.357 | 0.000 | 0.000 | 0.346 | 0.058 | ||
| 1 spectrum, EIGAVK | 0.165 | 0.319 | 0.057 | 0.000 | 0.000 | 0.372 | 0.087 | 0.000 | ||
| 7 spectra, YLECSALTQR | 0.000 | 0.121 | 0.267 | 0.000 | 0.214 | 0.227 | 0.172 | 0.000 |
| Plot | Mito | Lyso or Perox | ER | Golgi | PM | Cytosol | Nucleus | ||||||
| Expt B |
5 peptides |
16 spectra |
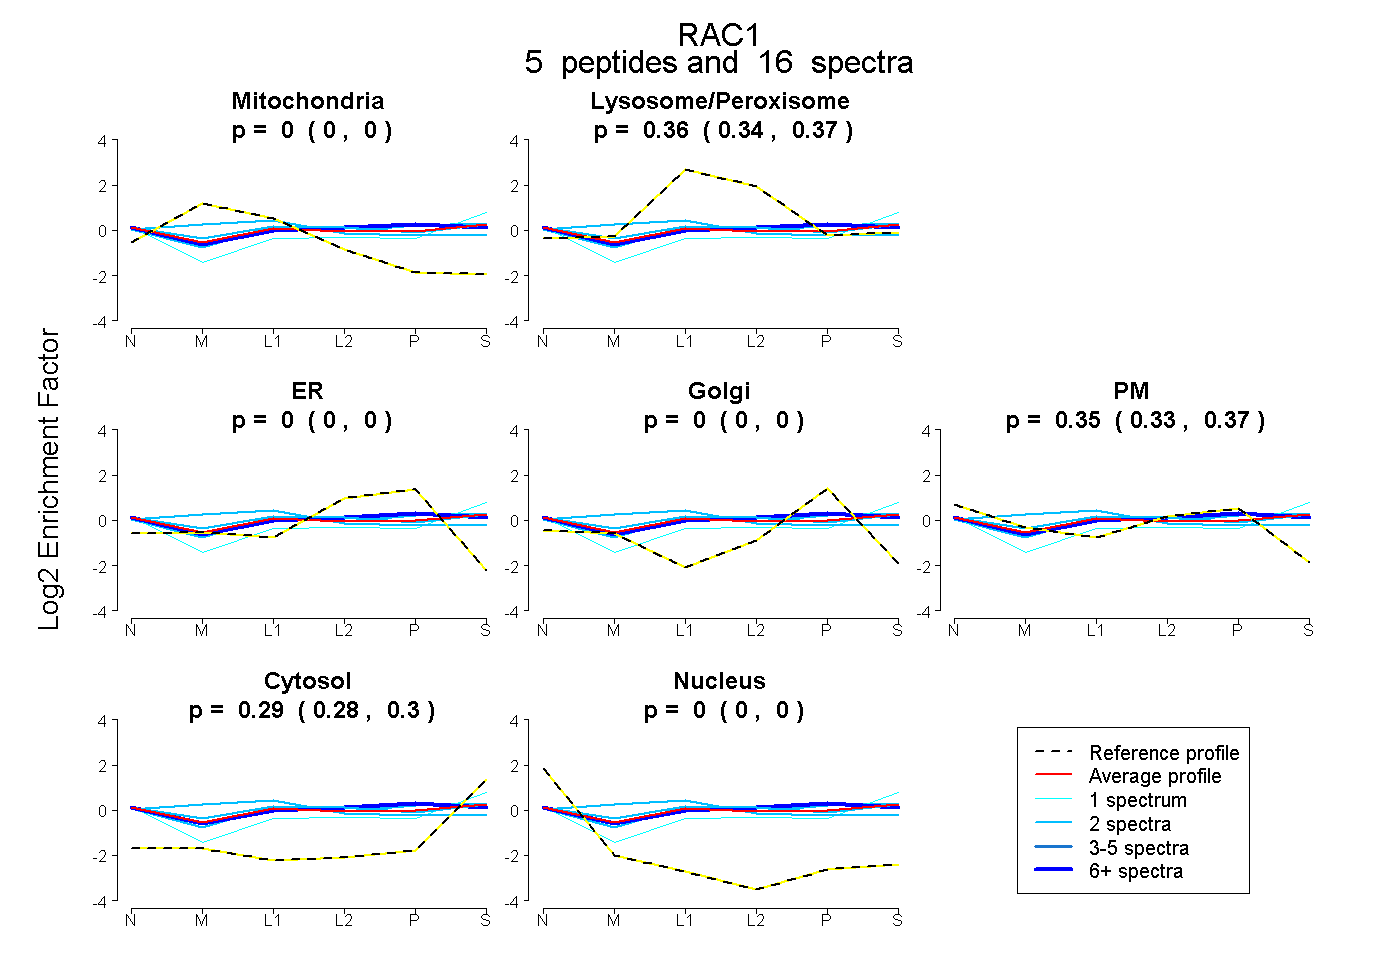 |
0.000 0.000 | 0.000 |
0.357 0.344 | 0.368 |
0.000 0.000 | 0.000 |
0.000 0.000 | 0.000 |
0.353 0.334 | 0.370 |
0.290 0.278 | 0.299 |
0.000 0.000 | 0.000 |
|||
| Plot | Lyso | Other | |||||||||||
| Expt C |
7 peptides |
118 spectra |
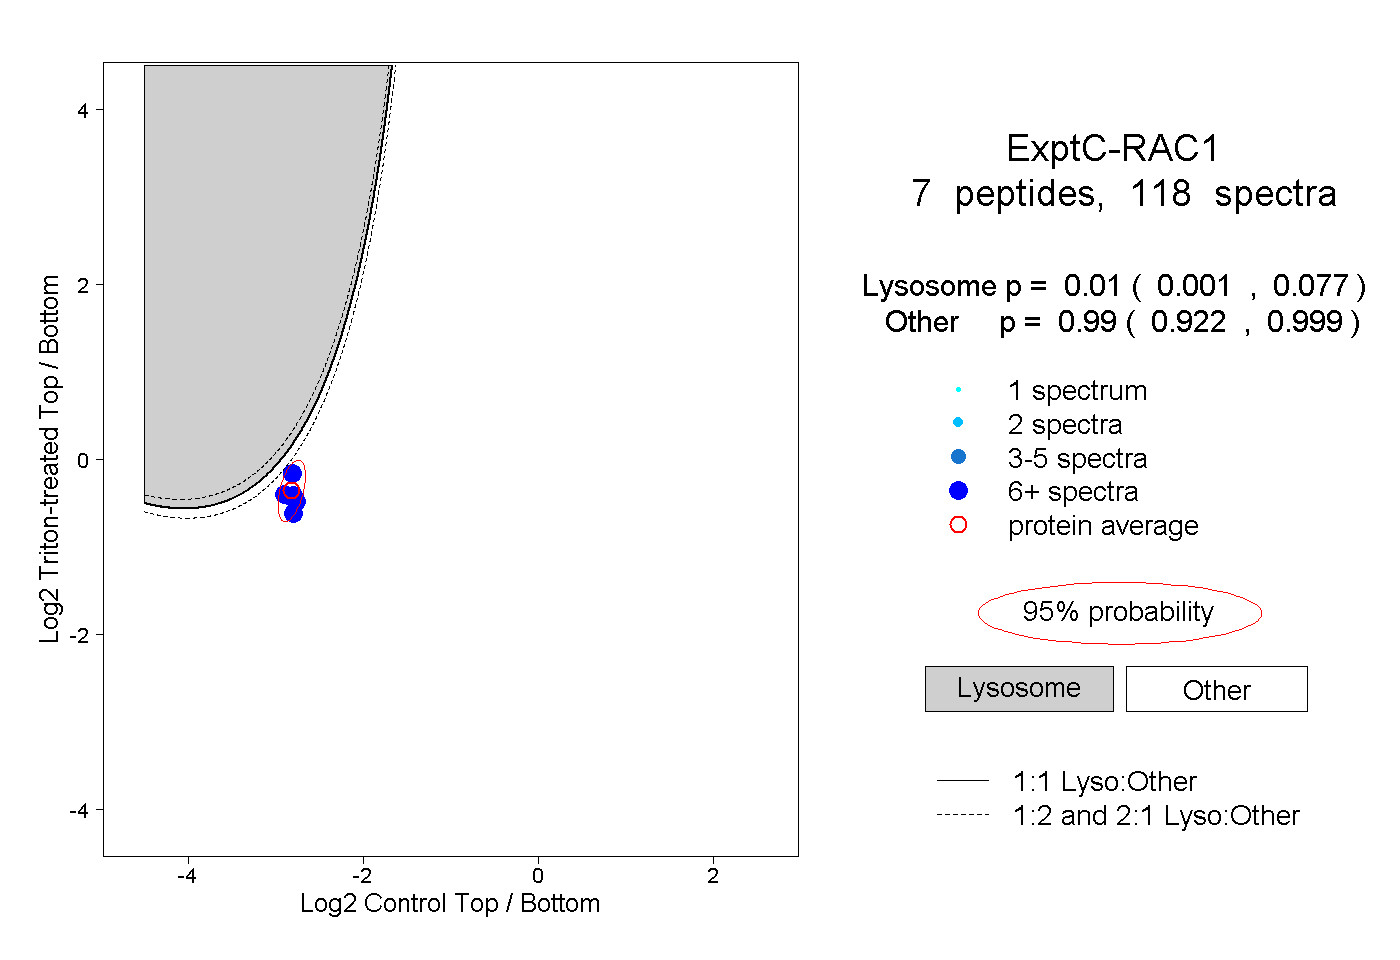 |
0.010 0.001 | 0.077 |
0.990 0.922 | 0.999 |
||||||||
| Plot | Lyso | Other | |||||||||||
| Expt D |
1 peptide |
1 spectrum |
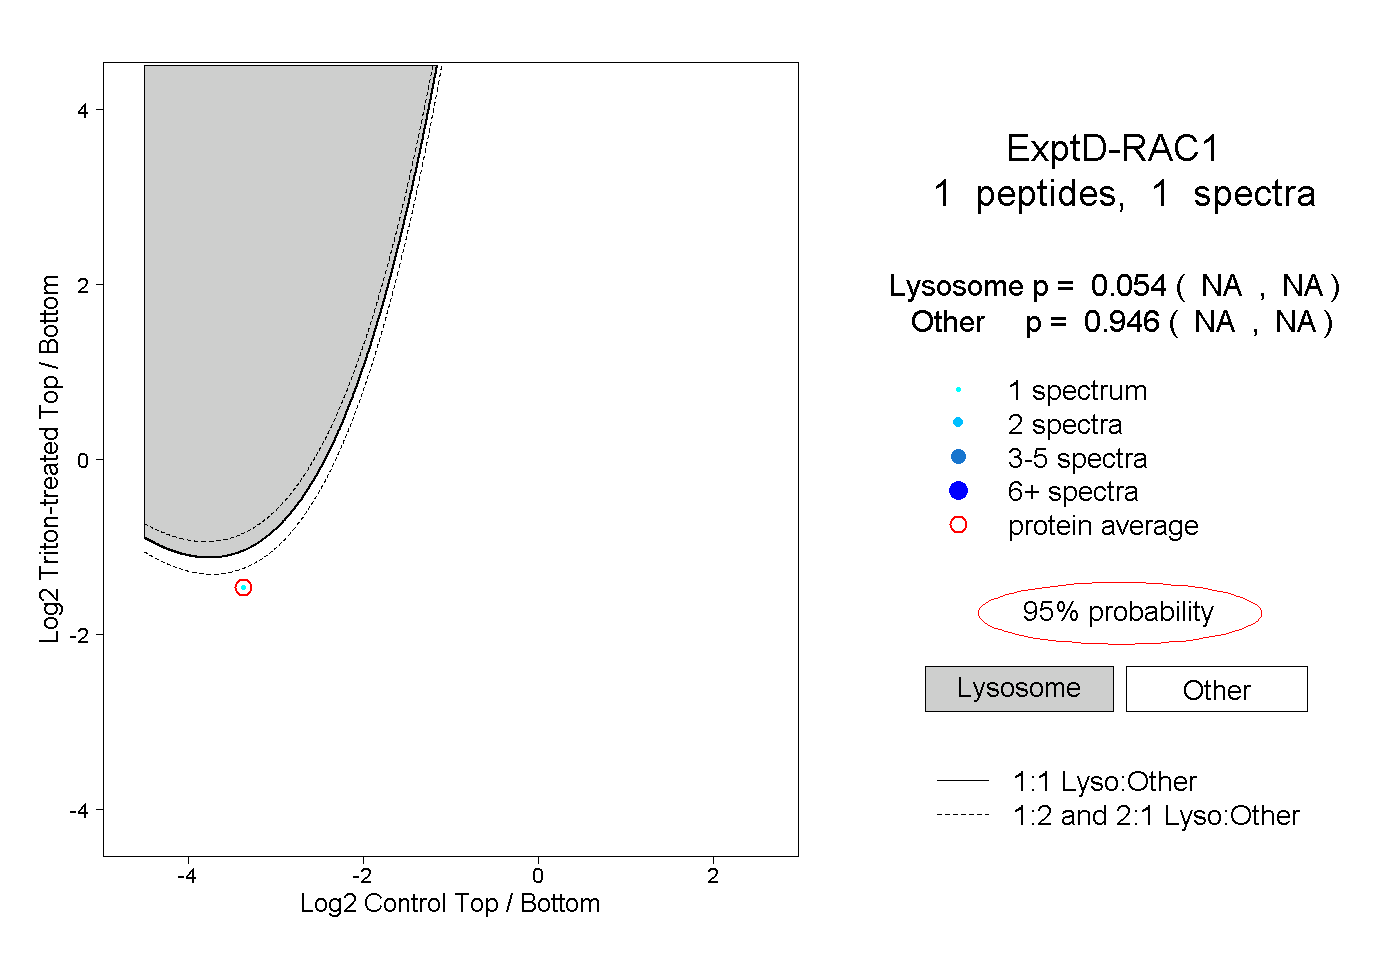 |
0.054 NA | NA |
0.946 NA | NA |