 10
10peptides
spectra
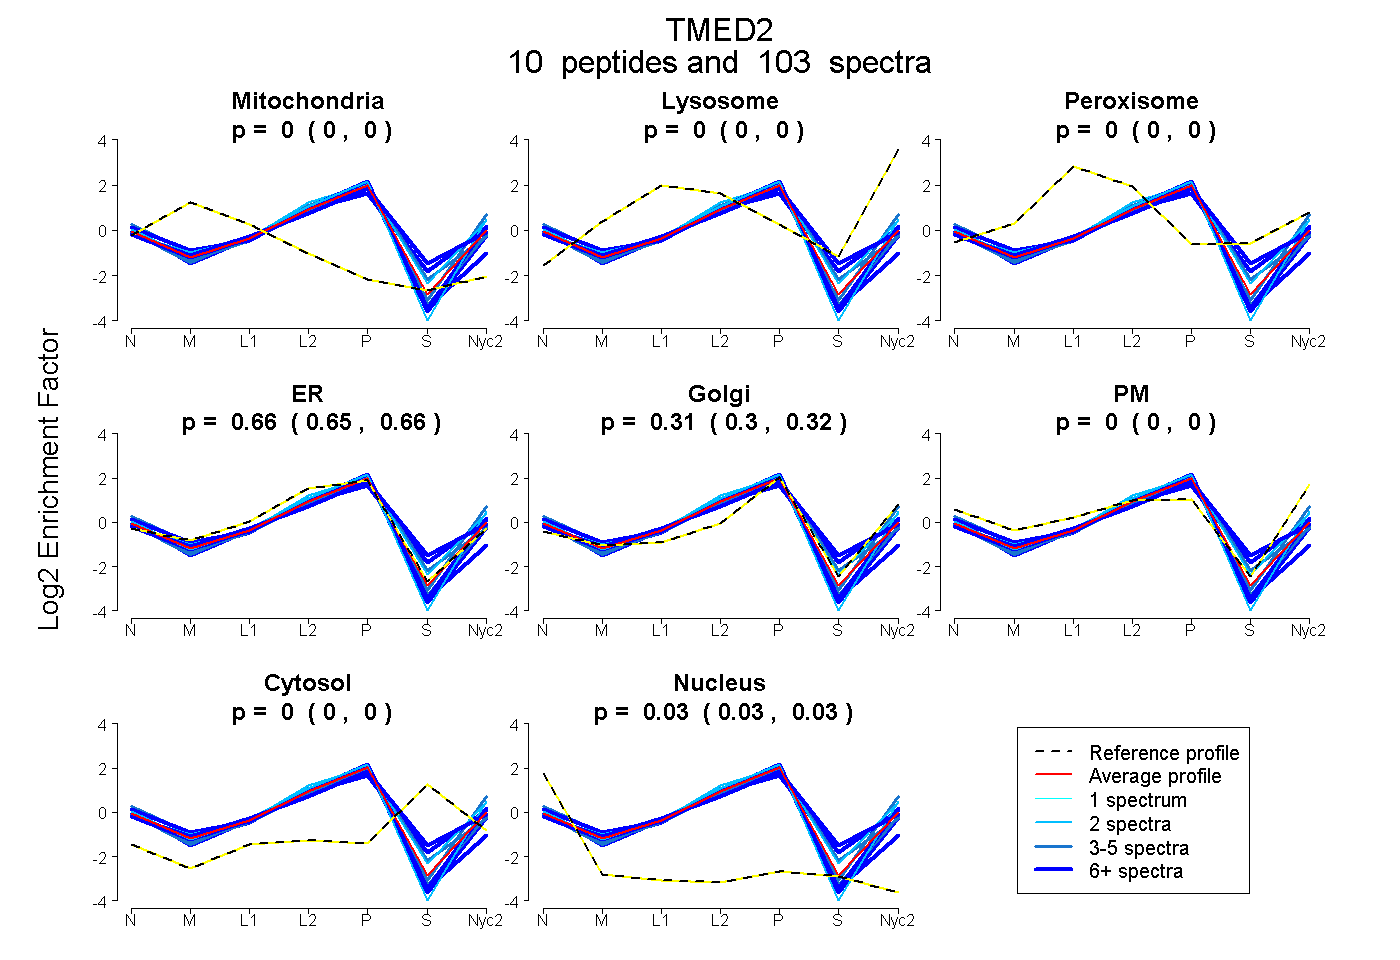
0.000 | 0.000
0.000 | 0.000
0.000 | 0.000
0.648 | 0.664
0.301 | 0.321
0.000 | 0.000
0.000 | 0.000
0.029 | 0.034
7peptides
spectra
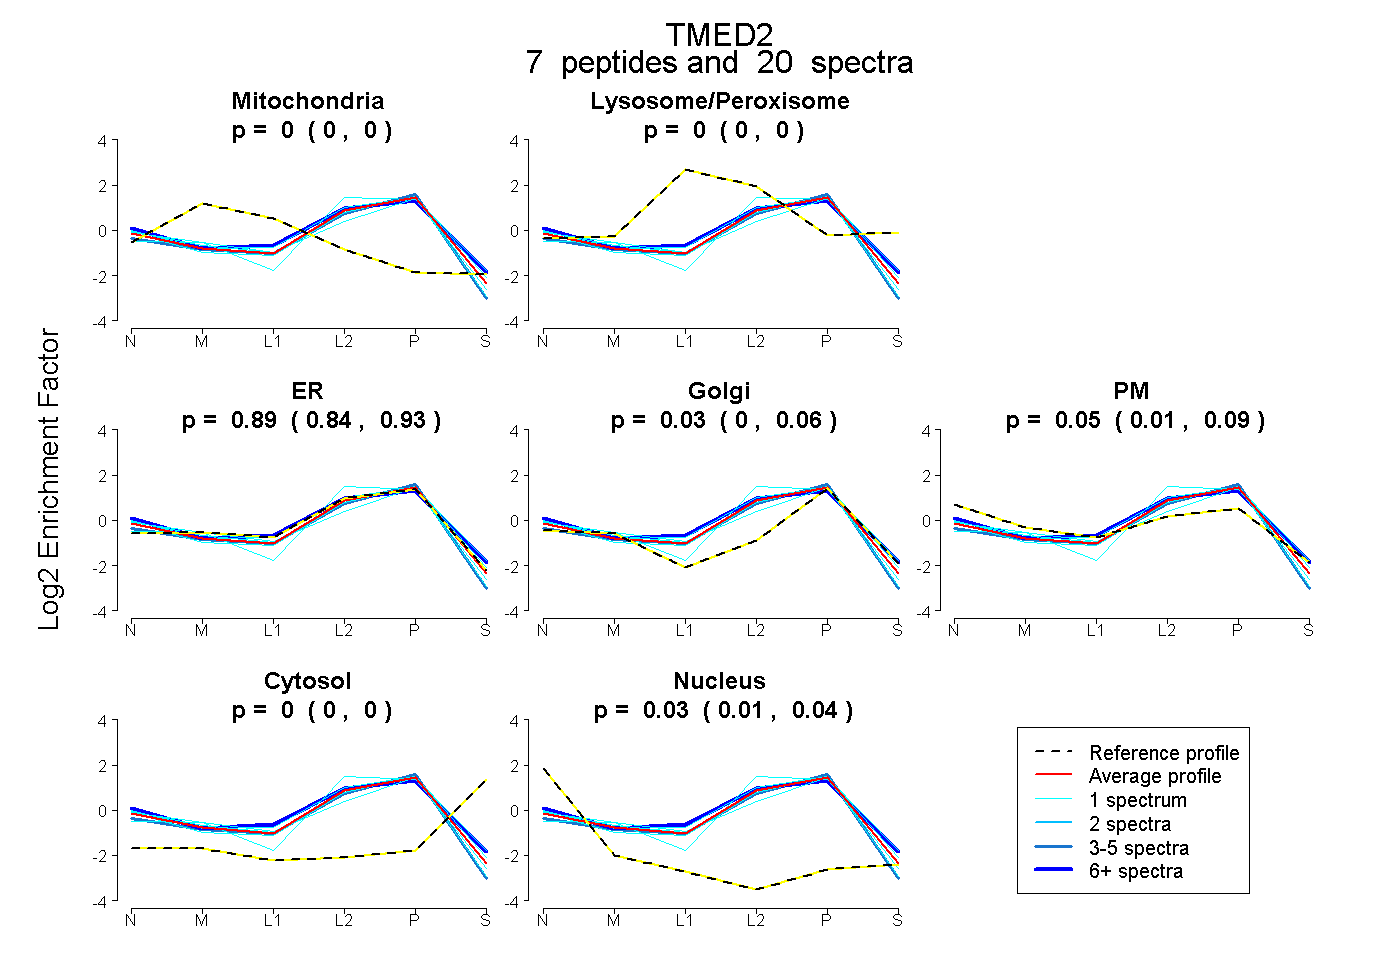
0.000 | 0.000
0.000 | 0.000
0.838 | 0.931
0.000 | 0.056
0.009 | 0.094
0.000 | 0.000
0.011 | 0.036
8peptides
spectra
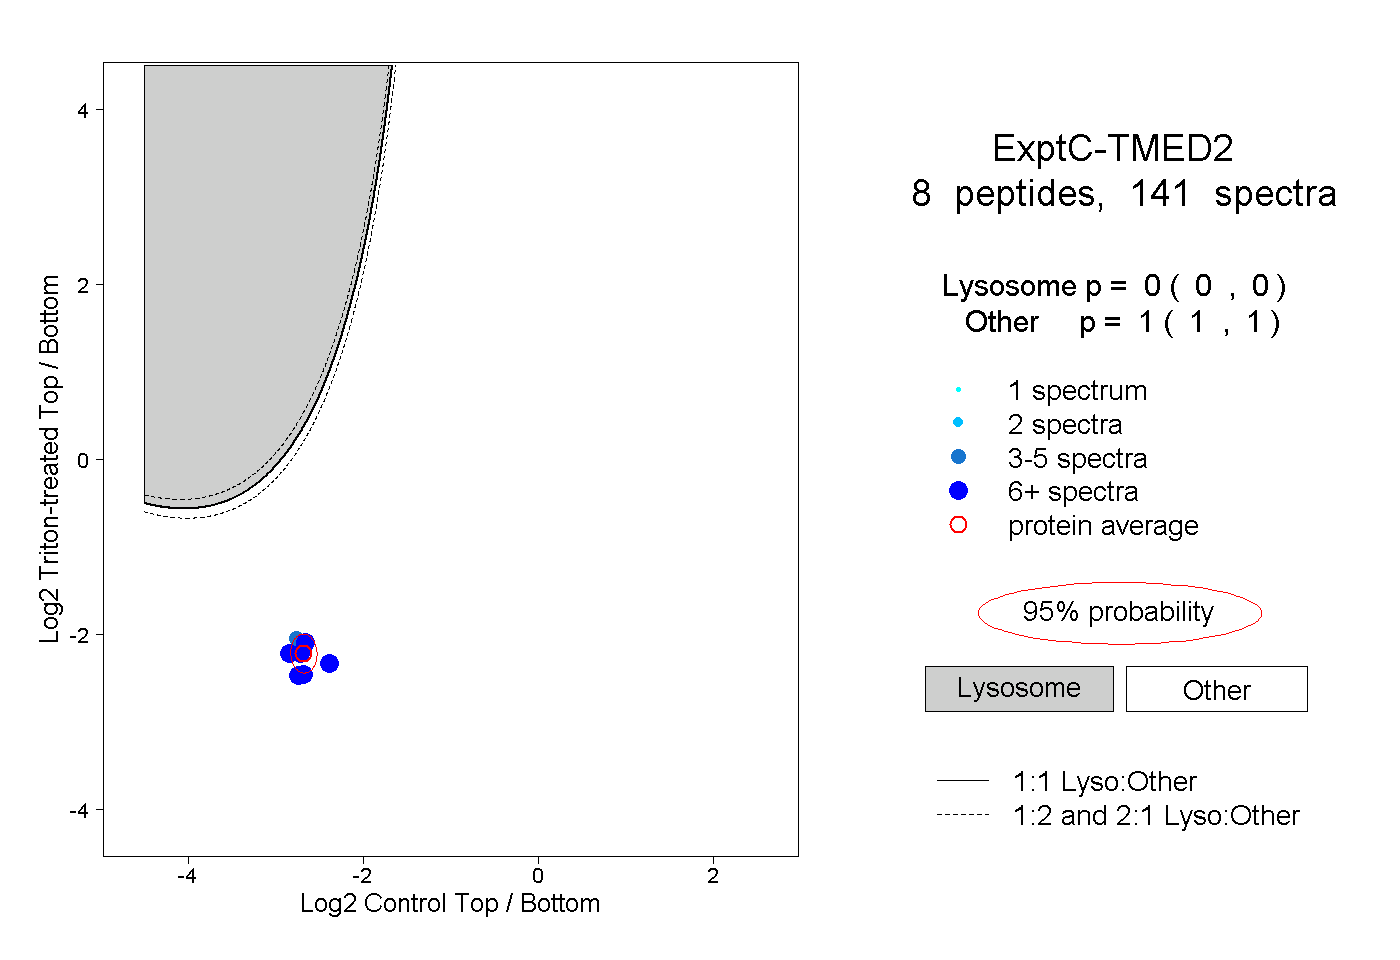
0.000 | 0.000
1.000 | 1.000
3peptides
spectra
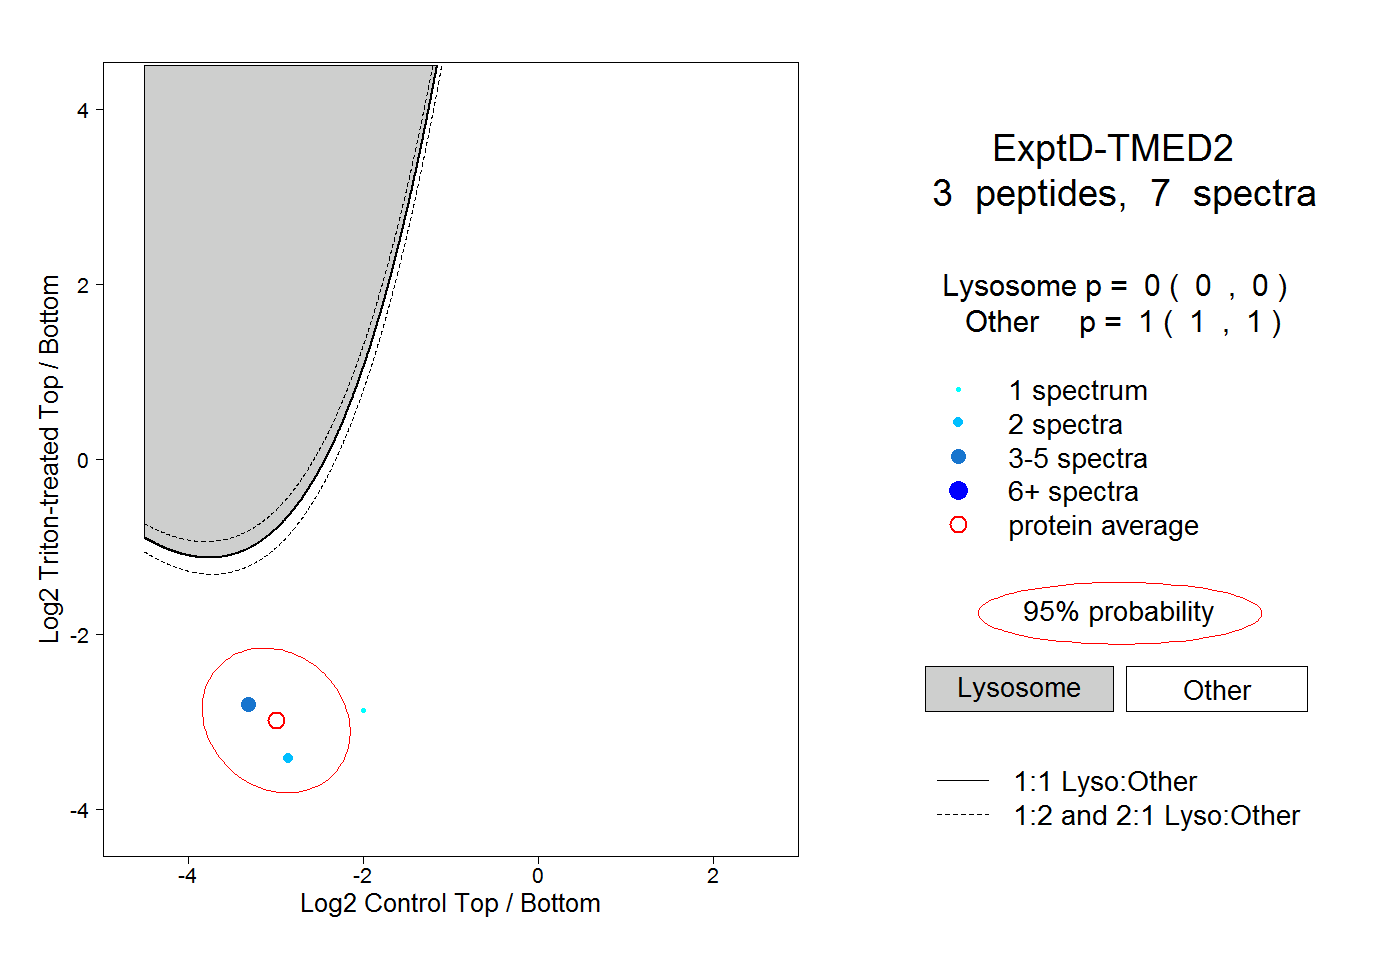
0.000 | 0.000
1.000 | 1.000