 10
10peptides
spectra
0.000 | 0.000
0.000 | 0.000
0.000 | 0.000
0.648 | 0.664
0.301 | 0.321
0.000 | 0.000
0.000 | 0.000
0.029 | 0.034
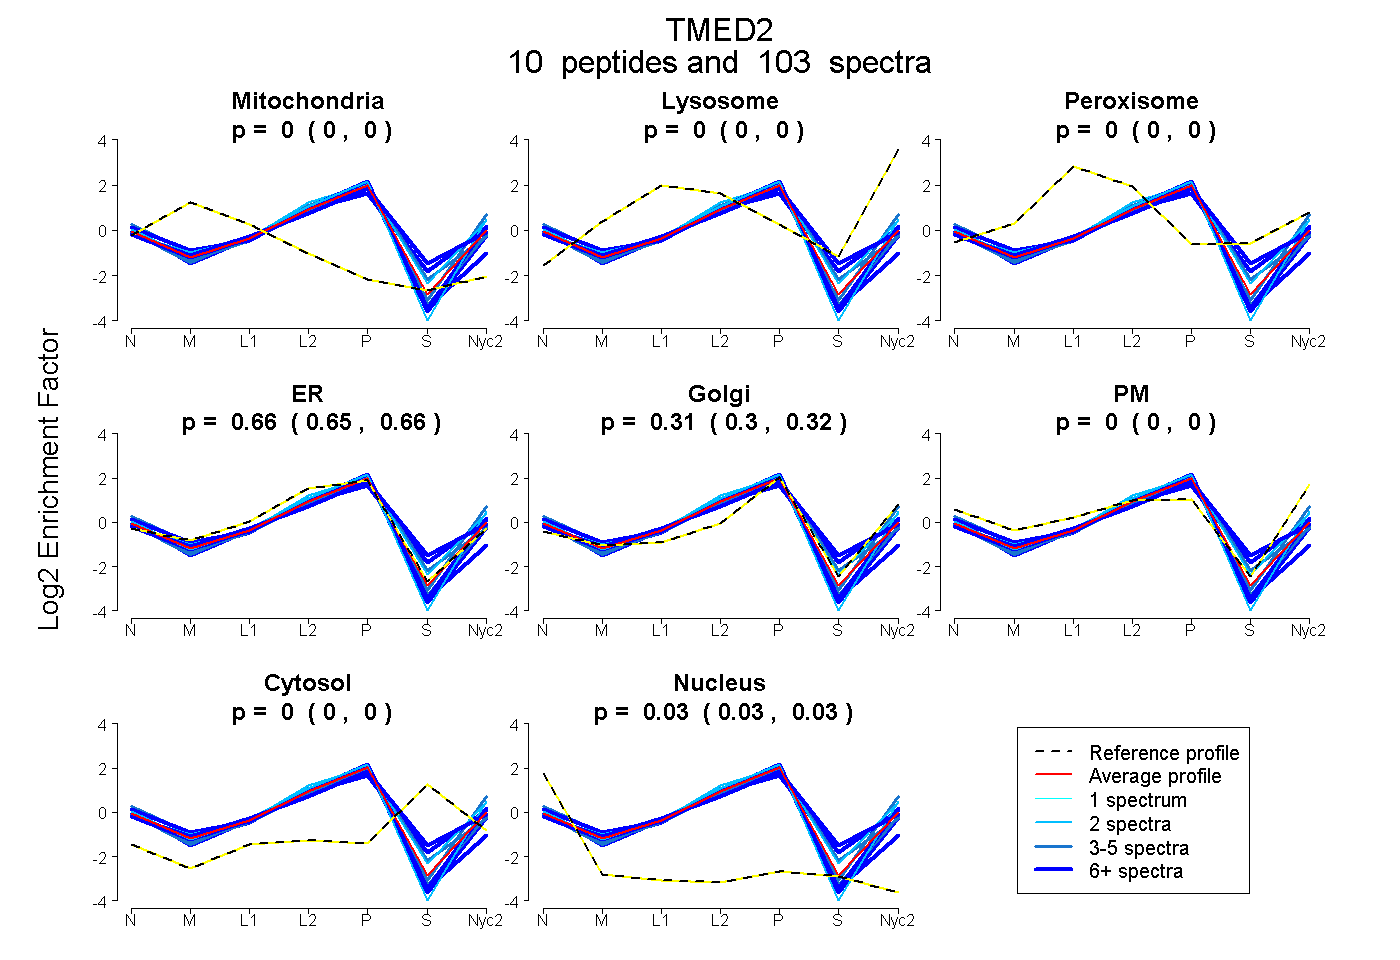
| Plot | Mito | Lyso | Perox | ER | Golgi | PM | Cytosol | Nucleus | |||||
| Expt A |
10 peptides |
103 spectra |
|
0.000 0.000 | 0.000 |
0.000 0.000 | 0.000 |
0.000 0.000 | 0.000 |
0.657 0.648 | 0.664 |
0.311 0.301 | 0.321 |
0.000 0.000 | 0.000 |
0.000 0.000 | 0.000 |
0.032 0.029 | 0.034 |
| 2 spectra, LEEMINELAVAMTAVK | 0.000 | 0.011 | 0.000 | 0.575 | 0.326 | 0.089 | 0.000 | 0.000 | ||
| 24 spectra, HEQEYMEVR | 0.000 | 0.000 | 0.000 | 0.542 | 0.169 | 0.173 | 0.114 | 0.001 | ||
| 18 spectra, AINDNTNSR | 0.000 | 0.000 | 0.000 | 0.742 | 0.202 | 0.000 | 0.000 | 0.056 | ||
| 24 spectra, FCFSNR | 0.000 | 0.000 | 0.000 | 0.897 | 0.000 | 0.000 | 0.000 | 0.103 | ||
| 3 spectra, FFEVR | 0.000 | 0.000 | 0.000 | 0.445 | 0.251 | 0.304 | 0.000 | 0.001 | ||
| 4 spectra, GQDMETEAHQNK | 0.000 | 0.000 | 0.000 | 0.657 | 0.302 | 0.000 | 0.000 | 0.041 | ||
| 5 spectra, IVMFTIDIGEAPK | 0.000 | 0.000 | 0.000 | 0.679 | 0.237 | 0.000 | 0.060 | 0.024 | ||
| 9 spectra, YTFAAHMDGTYK | 0.000 | 0.000 | 0.027 | 0.564 | 0.265 | 0.000 | 0.145 | 0.000 | ||
| 2 spectra, VTSGTK | 0.000 | 0.000 | 0.000 | 0.606 | 0.301 | 0.093 | 0.000 | 0.000 | ||
| 12 spectra, MSTMTPK | 0.000 | 0.000 | 0.000 | 0.645 | 0.354 | 0.000 | 0.000 | 0.001 |
| Plot | Mito | Lyso or Perox | ER | Golgi | PM | Cytosol | Nucleus | ||||||
| Expt B |
7 peptides |
20 spectra |
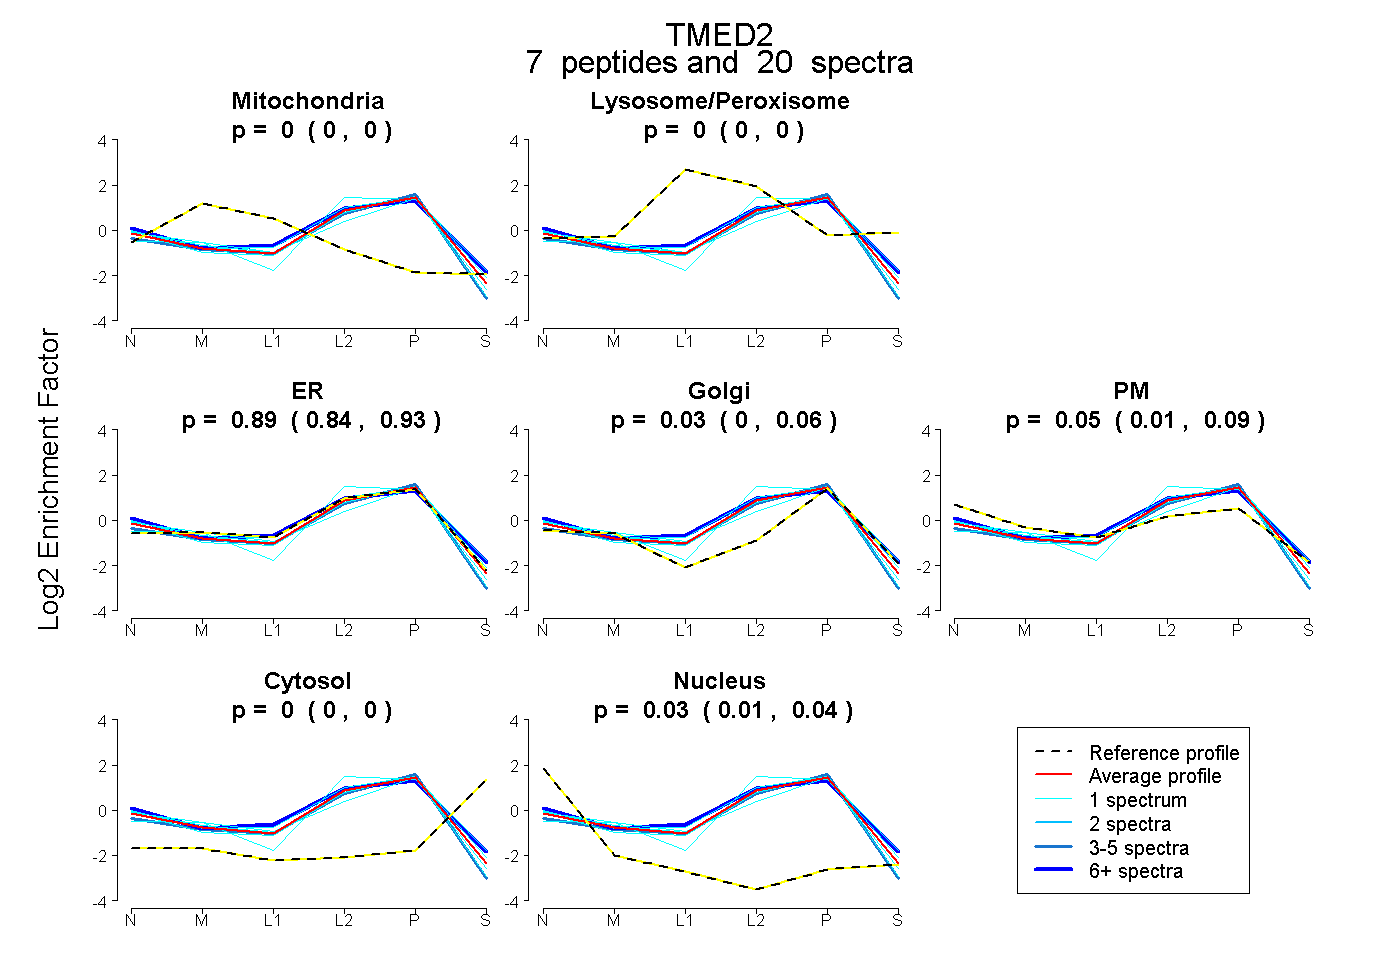 |
0.000 0.000 | 0.000 |
0.000 0.000 | 0.000 |
0.890 0.838 | 0.931 |
0.030 0.000 | 0.056 |
0.055 0.009 | 0.094 |
0.000 0.000 | 0.000 |
0.025 0.011 | 0.036 |
|||
| Plot | Lyso | Other | |||||||||||
| Expt C |
8 peptides |
141 spectra |
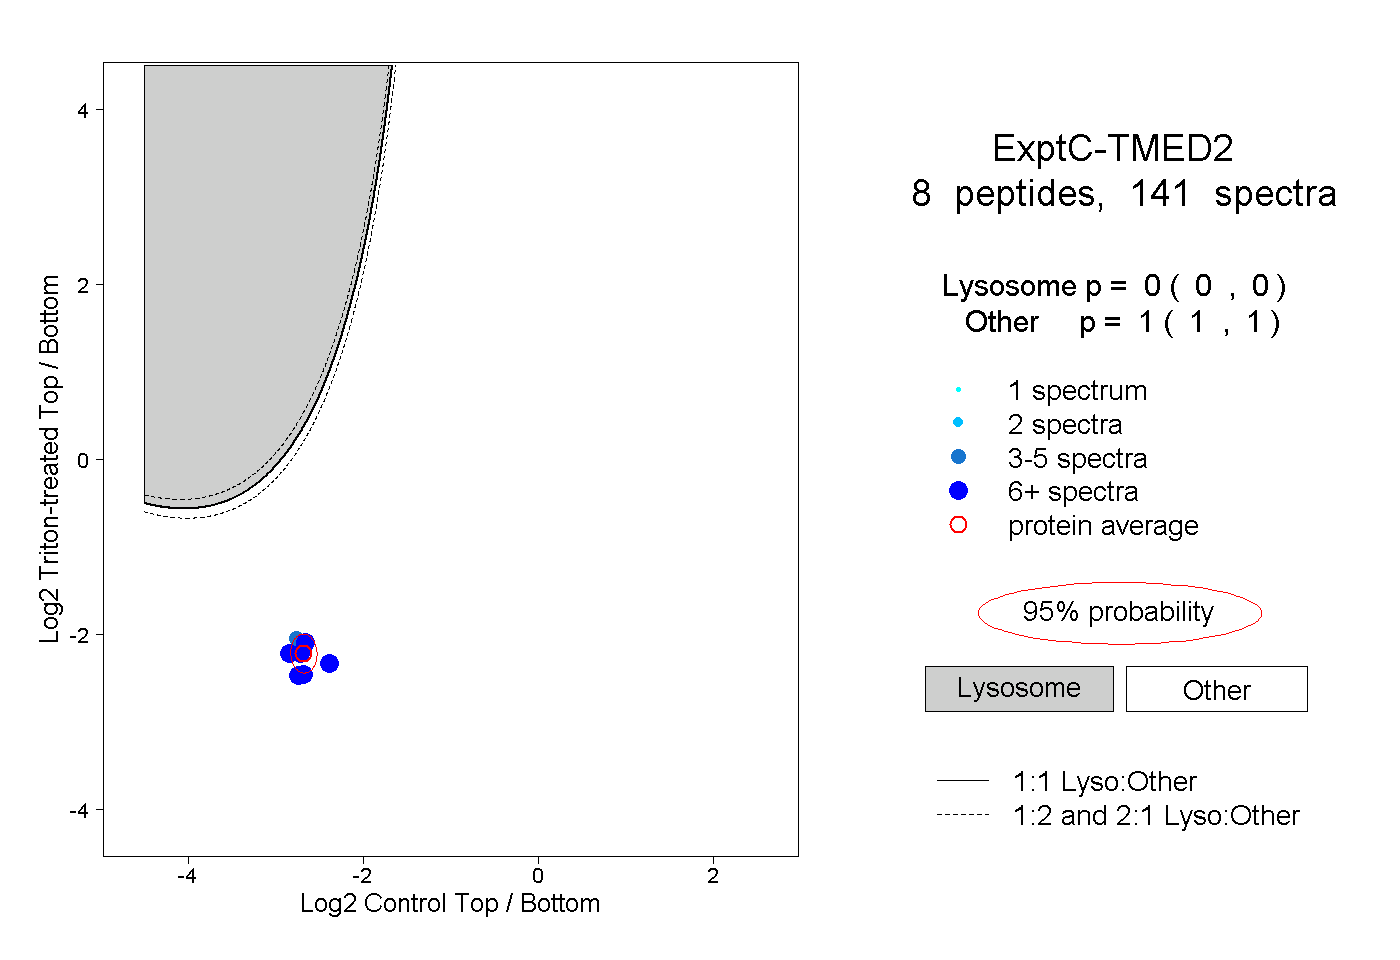 |
0.000 0.000 | 0.000 |
1.000 1.000 | 1.000 |
||||||||
| Plot | Lyso | Other | |||||||||||
| Expt D |
3 peptides |
7 spectra |
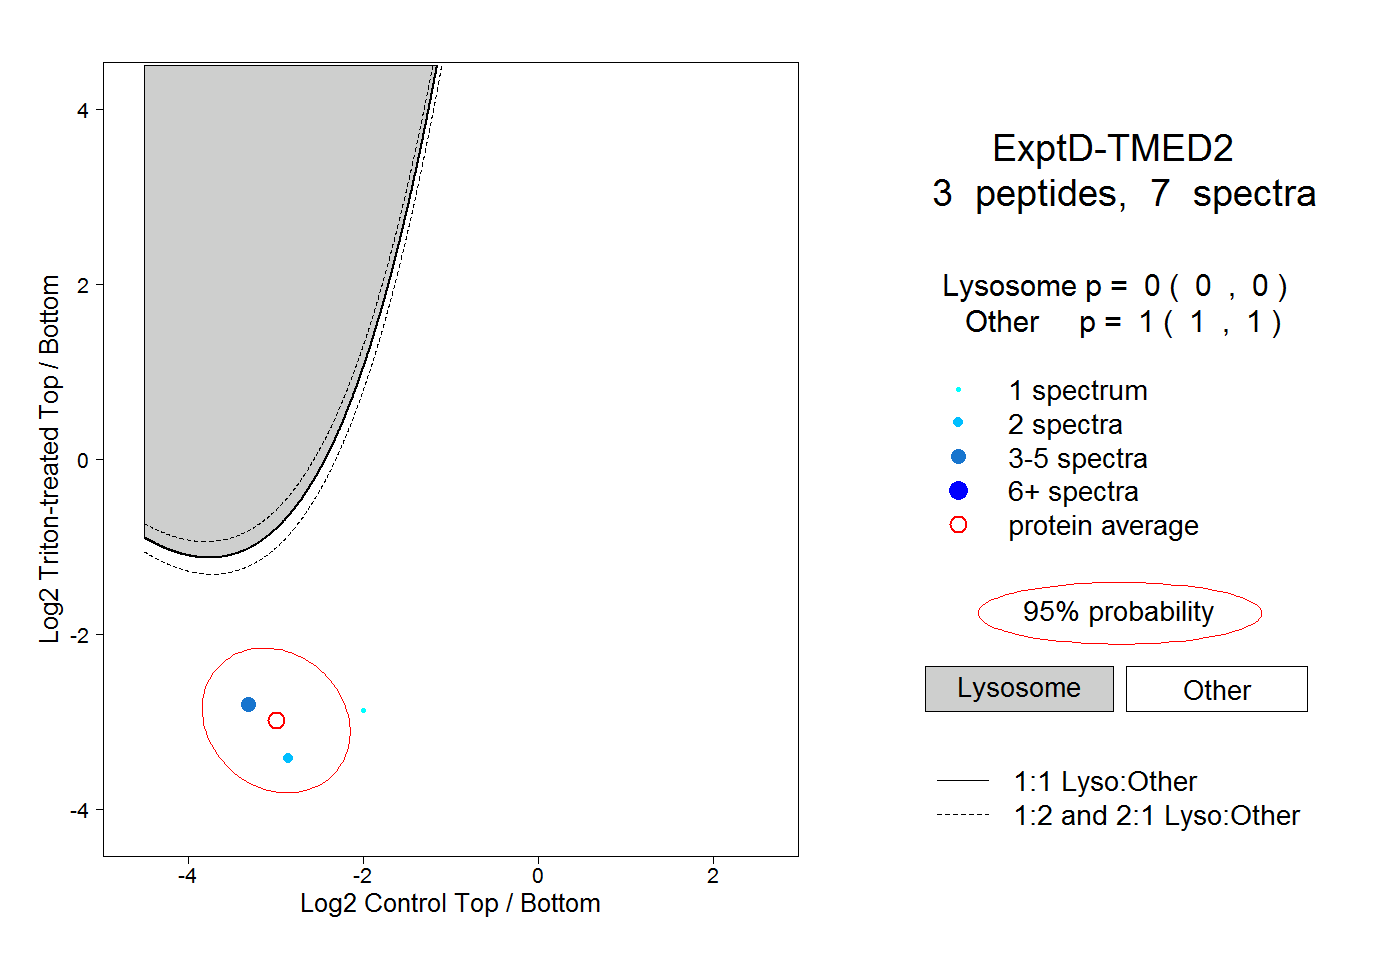 |
0.000 0.000 | 0.000 |
1.000 1.000 | 1.000 |