 5
5peptides
spectra
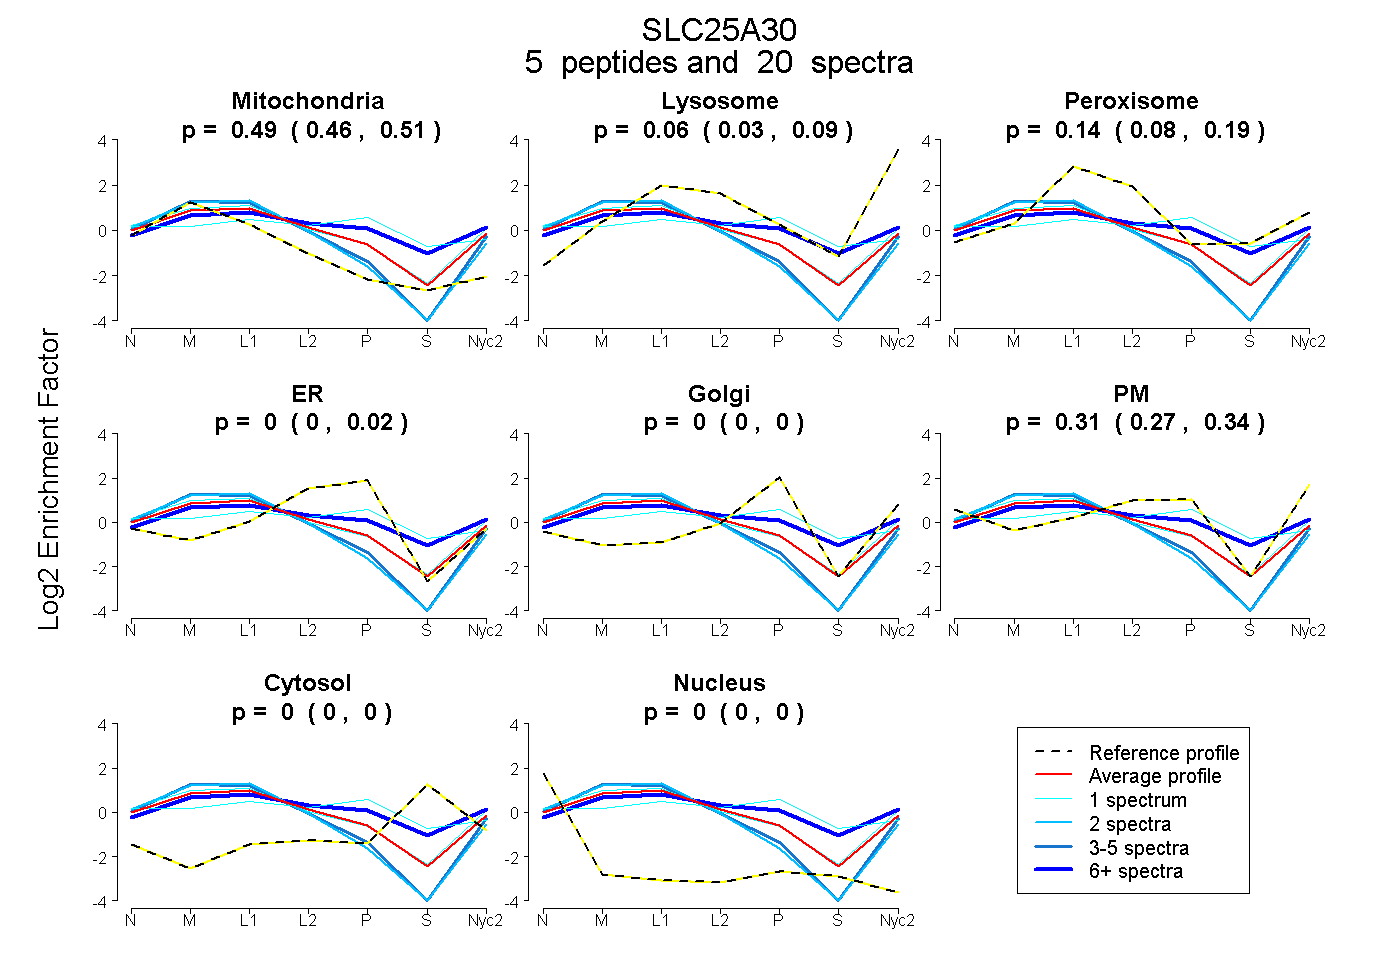
0.457 | 0.510
0.033 | 0.089
0.077 | 0.186
0.000 | 0.018
0.000 | 0.000
0.267 | 0.343
0.000 | 0.000
0.000 | 0.000
8peptides
spectra
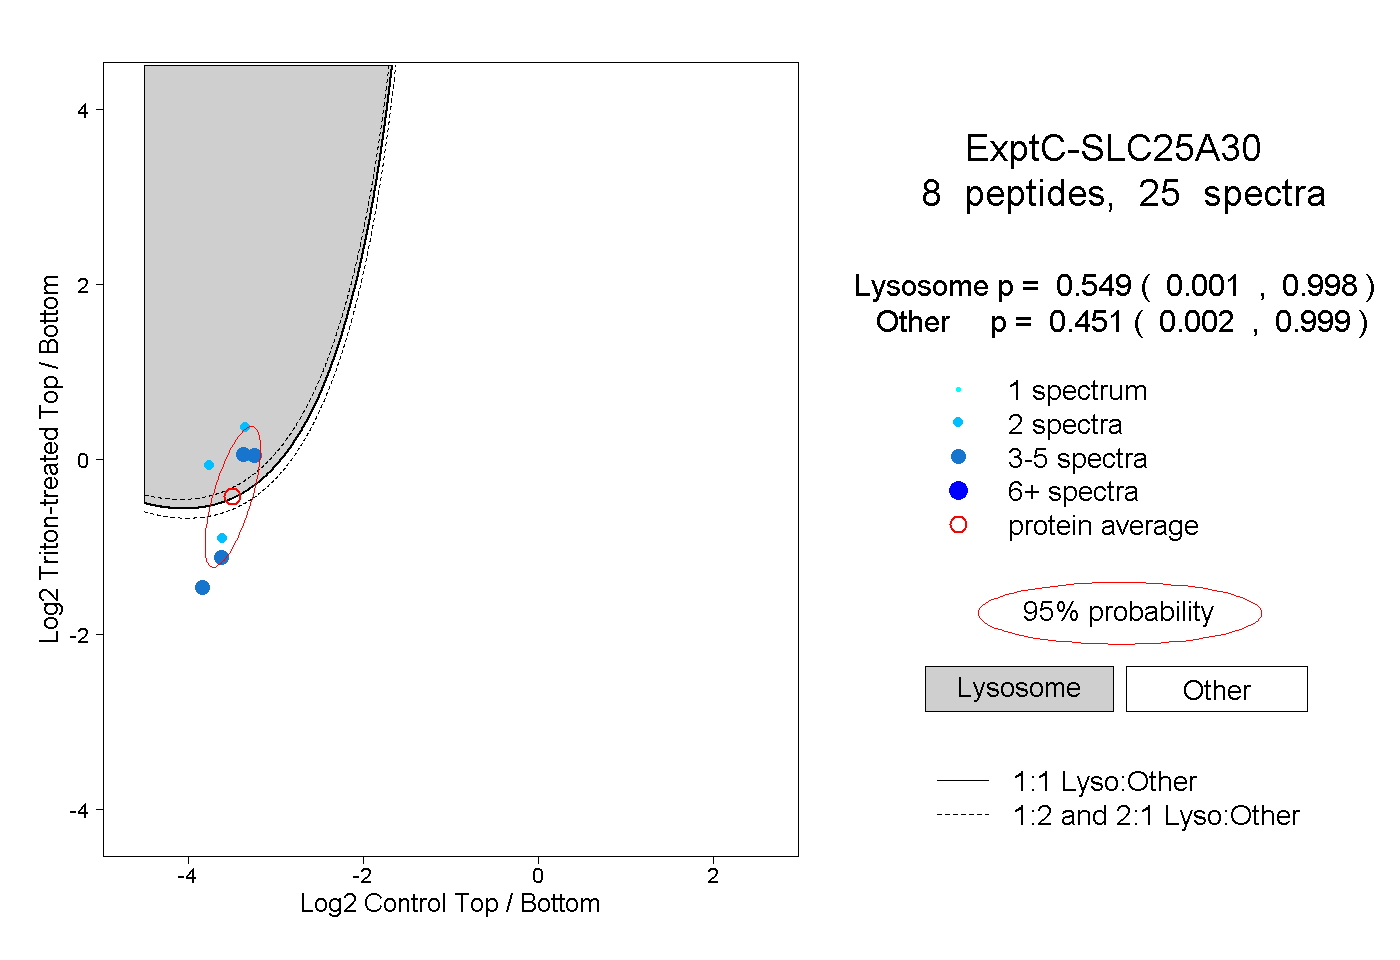
0.001 | 0.998
0.002 | 0.999
1peptide
spectrum
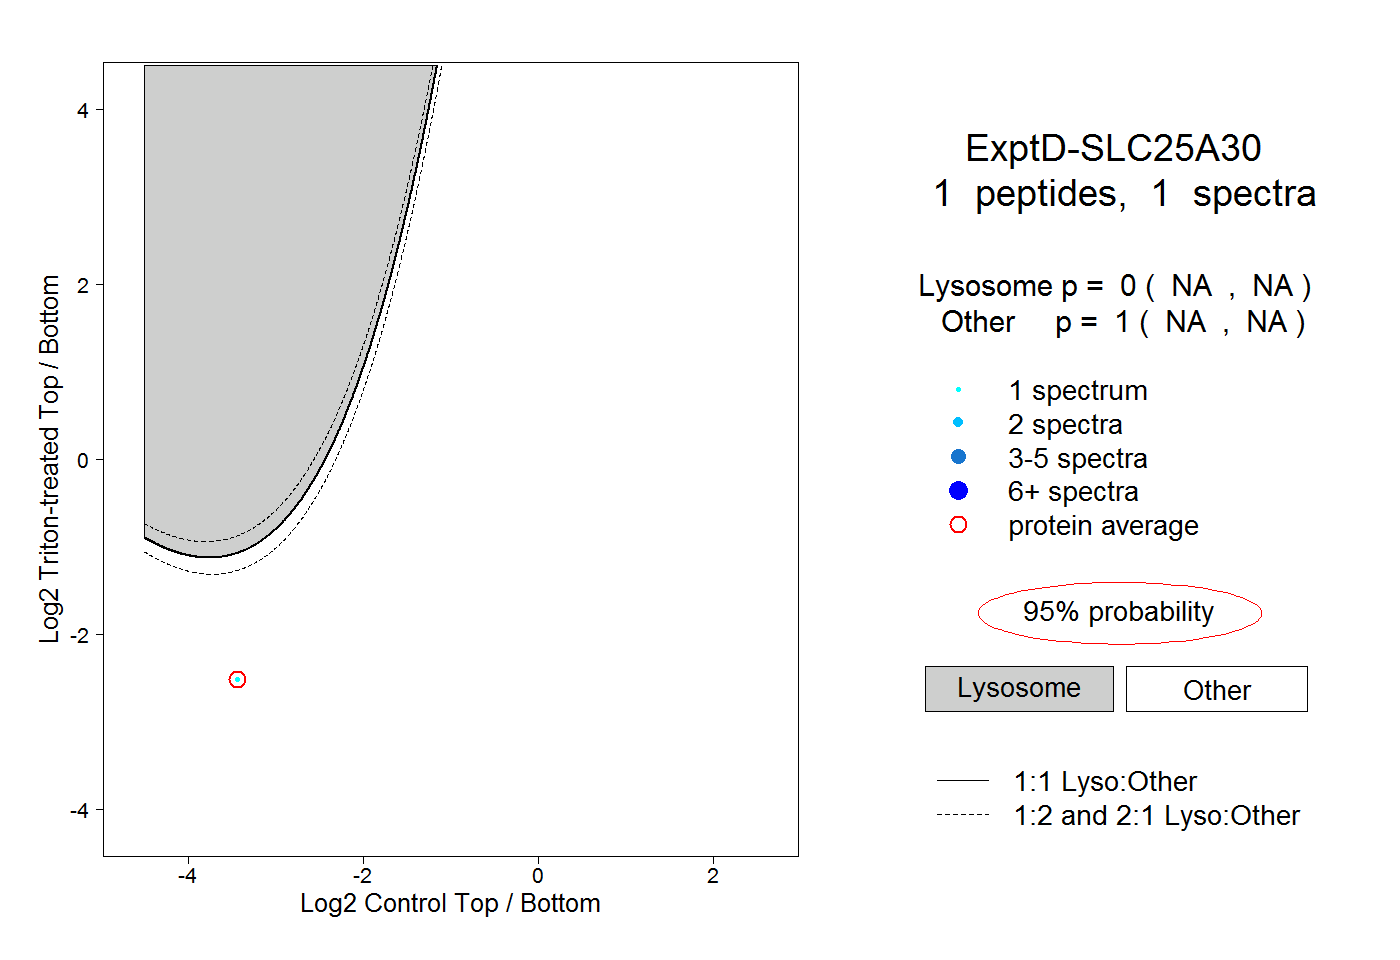
NA | NA
NA | NA