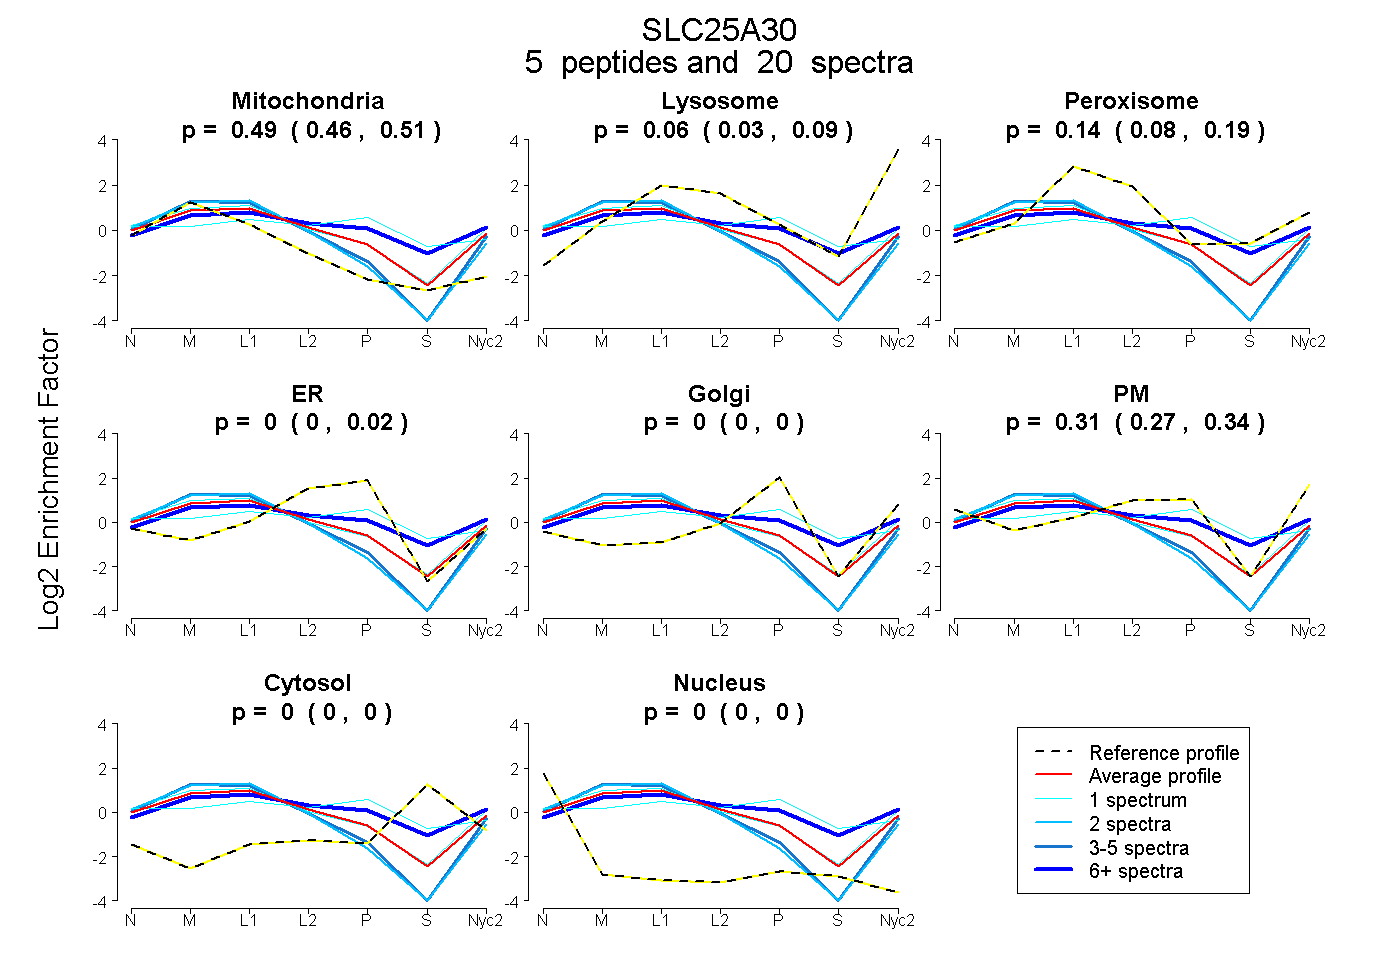
 5
5peptides
spectra
0.457 | 0.510
0.033 | 0.089
0.077 | 0.186
0.000 | 0.018
0.000 | 0.000
0.267 | 0.343
0.000 | 0.000
0.000 | 0.000
| Plot | Mito | Lyso | Perox | ER | Golgi | PM | Cytosol | Nucleus | |||||
| Expt A |
5 peptides |
20 spectra |
|
0.485 0.457 | 0.510 |
0.061 0.033 | 0.089 |
0.141 0.077 | 0.186 |
0.000 0.000 | 0.018 |
0.000 0.000 | 0.000 |
0.313 0.267 | 0.343 |
0.000 0.000 | 0.000 |
0.000 0.000 | 0.000 |
| 2 spectra, GVSLTAQR | 0.717 | 0.092 | 0.000 | 0.000 | 0.000 | 0.191 | 0.000 | 0.000 | ||
| 1 spectrum, GFWPNWLR | 0.473 | 0.085 | 0.132 | 0.000 | 0.000 | 0.310 | 0.000 | 0.000 | ||
| 13 spectra, GMLHALMR | 0.246 | 0.026 | 0.402 | 0.000 | 0.291 | 0.000 | 0.034 | 0.000 | ||
| 1 spectrum, QASYGTIK | 0.177 | 0.000 | 0.309 | 0.122 | 0.262 | 0.000 | 0.131 | 0.000 | ||
| 3 spectra, ALYSGIAPAMLR | 0.662 | 0.117 | 0.000 | 0.000 | 0.000 | 0.221 | 0.000 | 0.000 |
| Plot | Lyso | Other | |||||||||||
| Expt C |
8 peptides |
25 spectra |
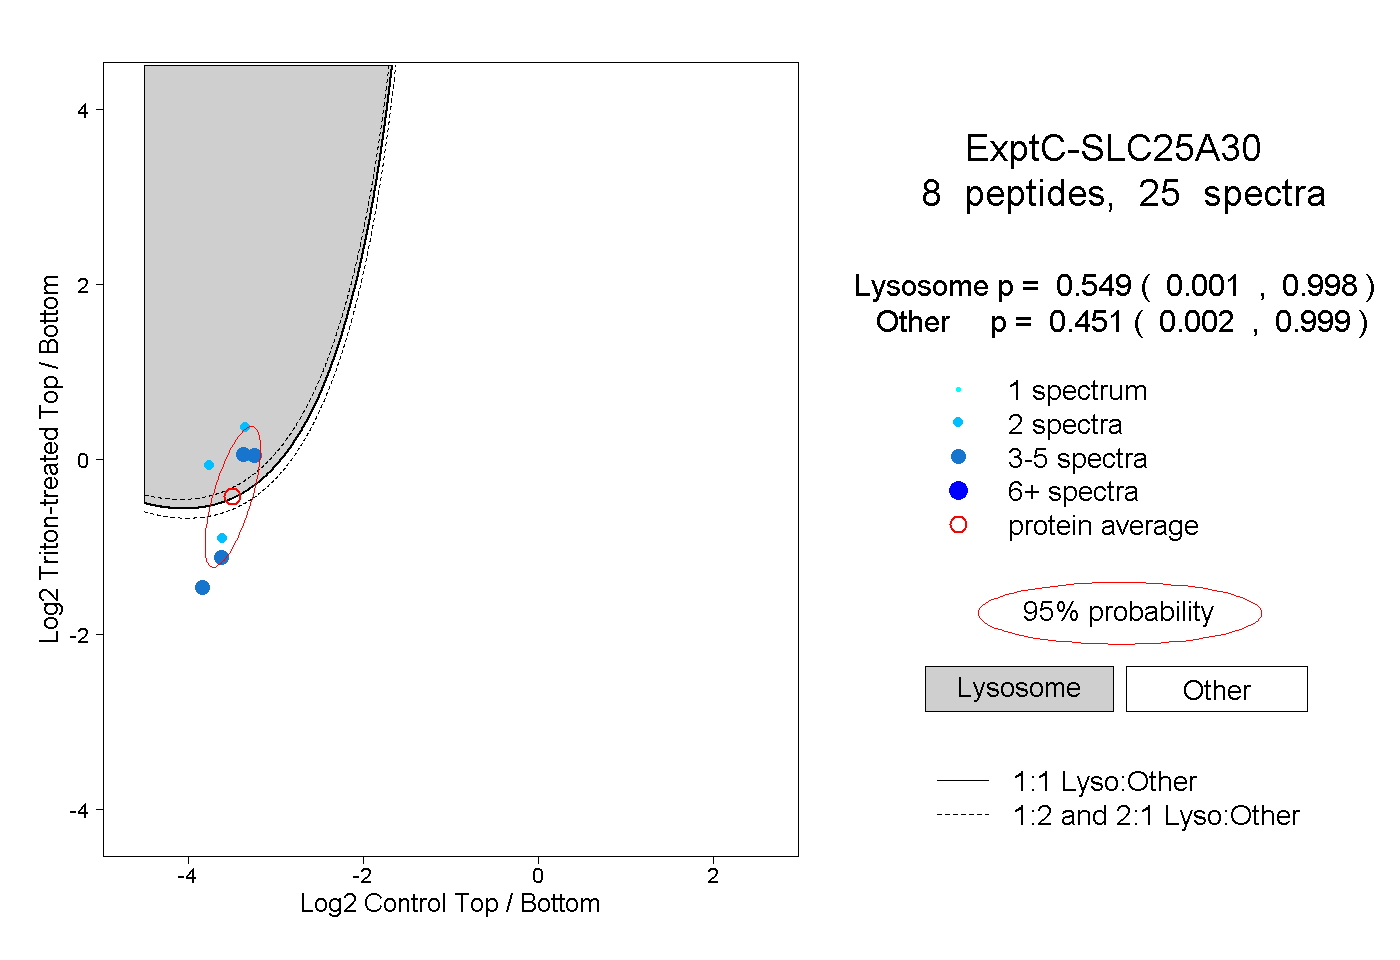 |
0.549 0.001 | 0.998 |
0.451 0.002 | 0.999 |
||||||||
| Plot | Lyso | Other | |||||||||||
| Expt D |
1 peptide |
1 spectrum |
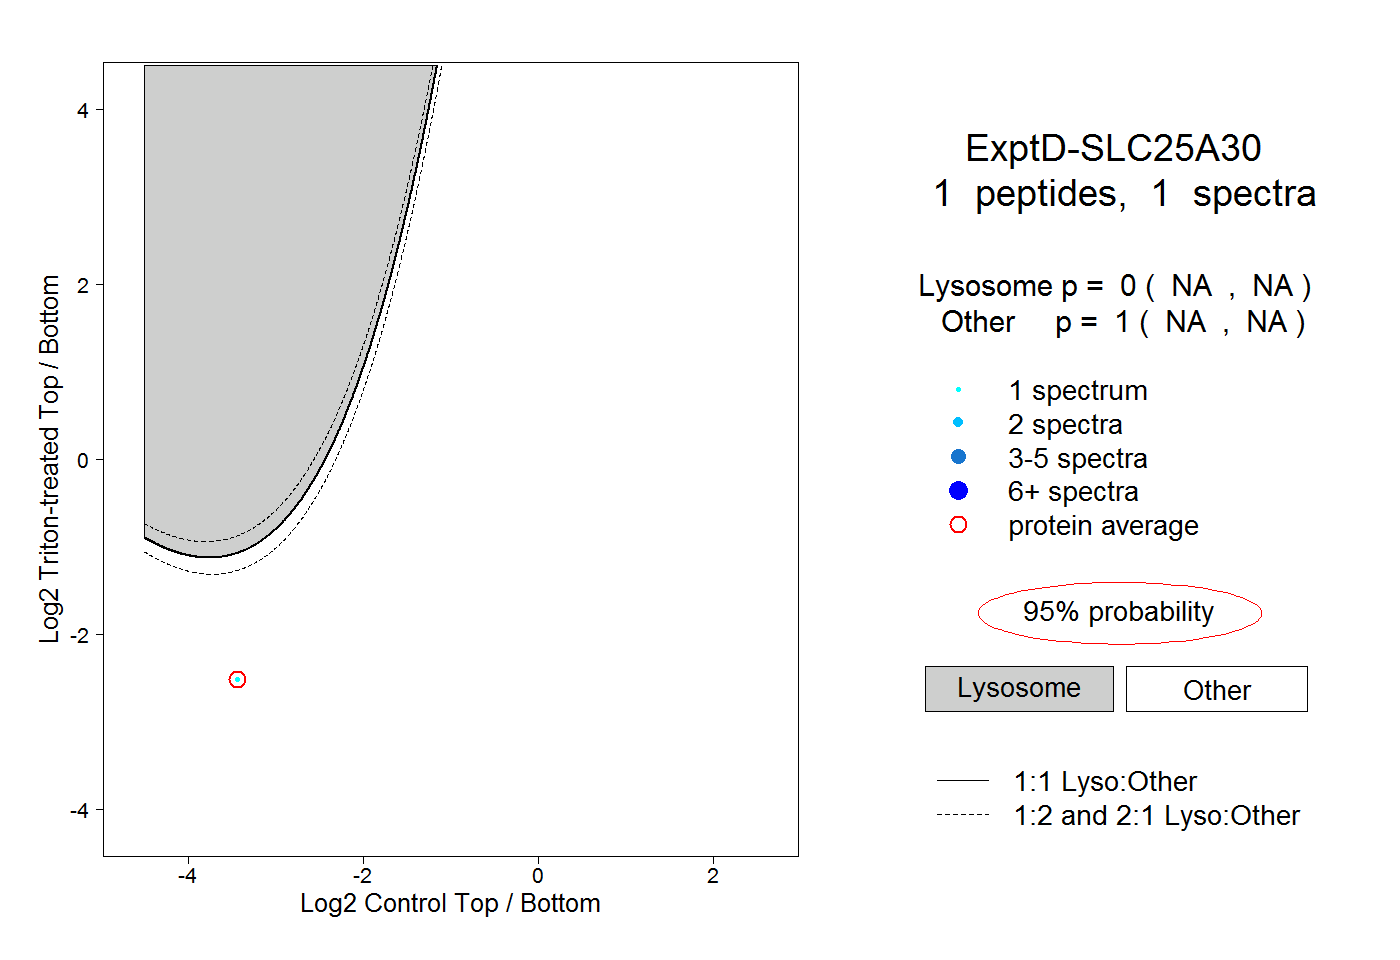 |
0.000 NA | NA |
1.000 NA | NA |