 6
6peptides
spectra
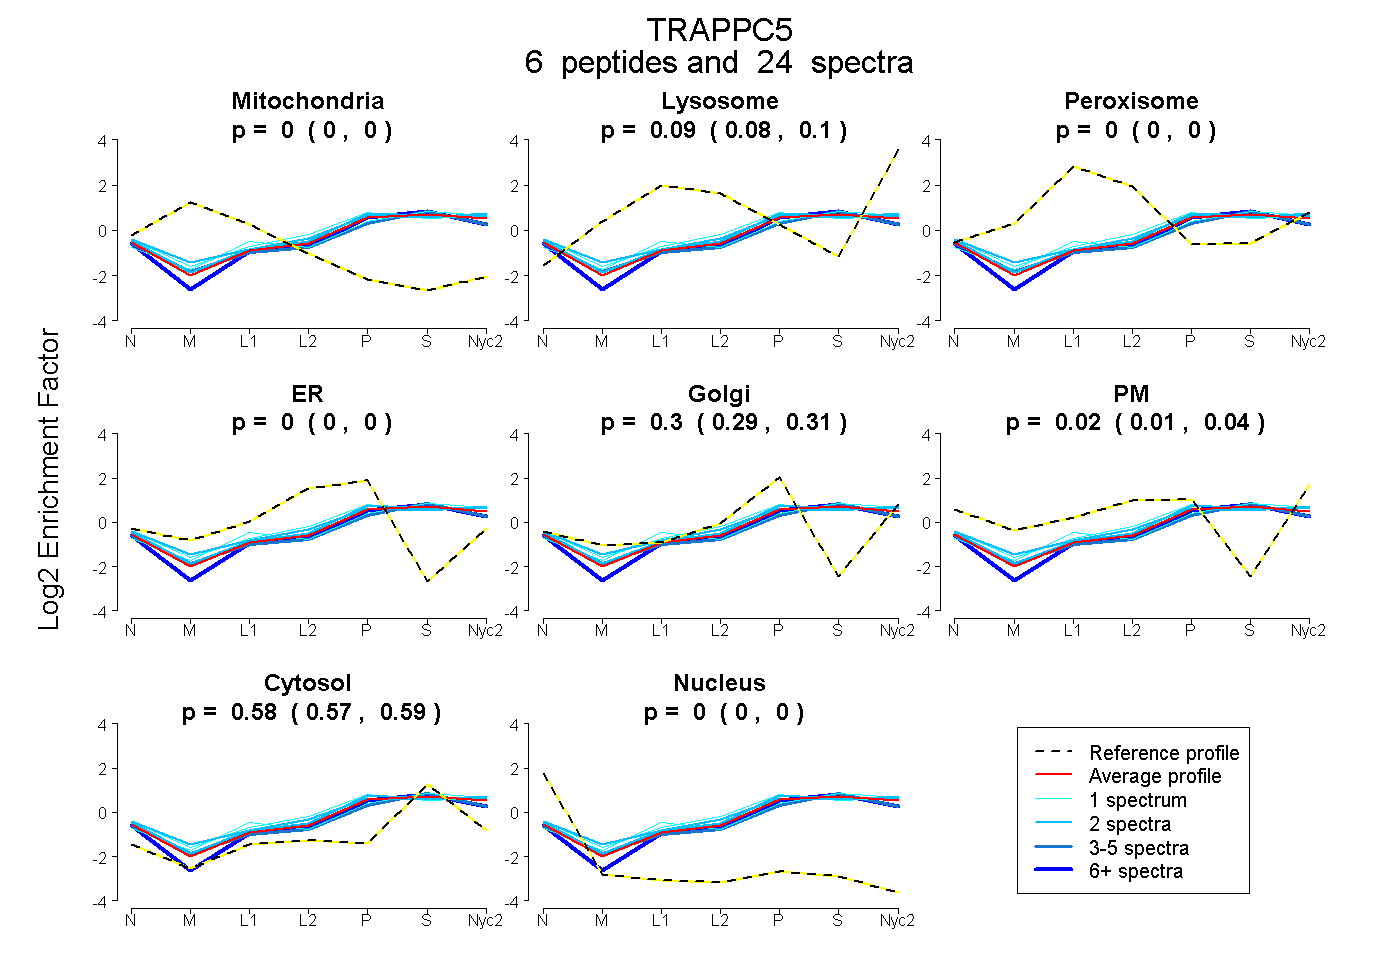
0.000 | 0.000
0.084 | 0.100
0.000 | 0.000
0.000 | 0.000
0.286 | 0.314
0.010 | 0.038
0.573 | 0.586
0.000 | 0.000
2peptides
spectra
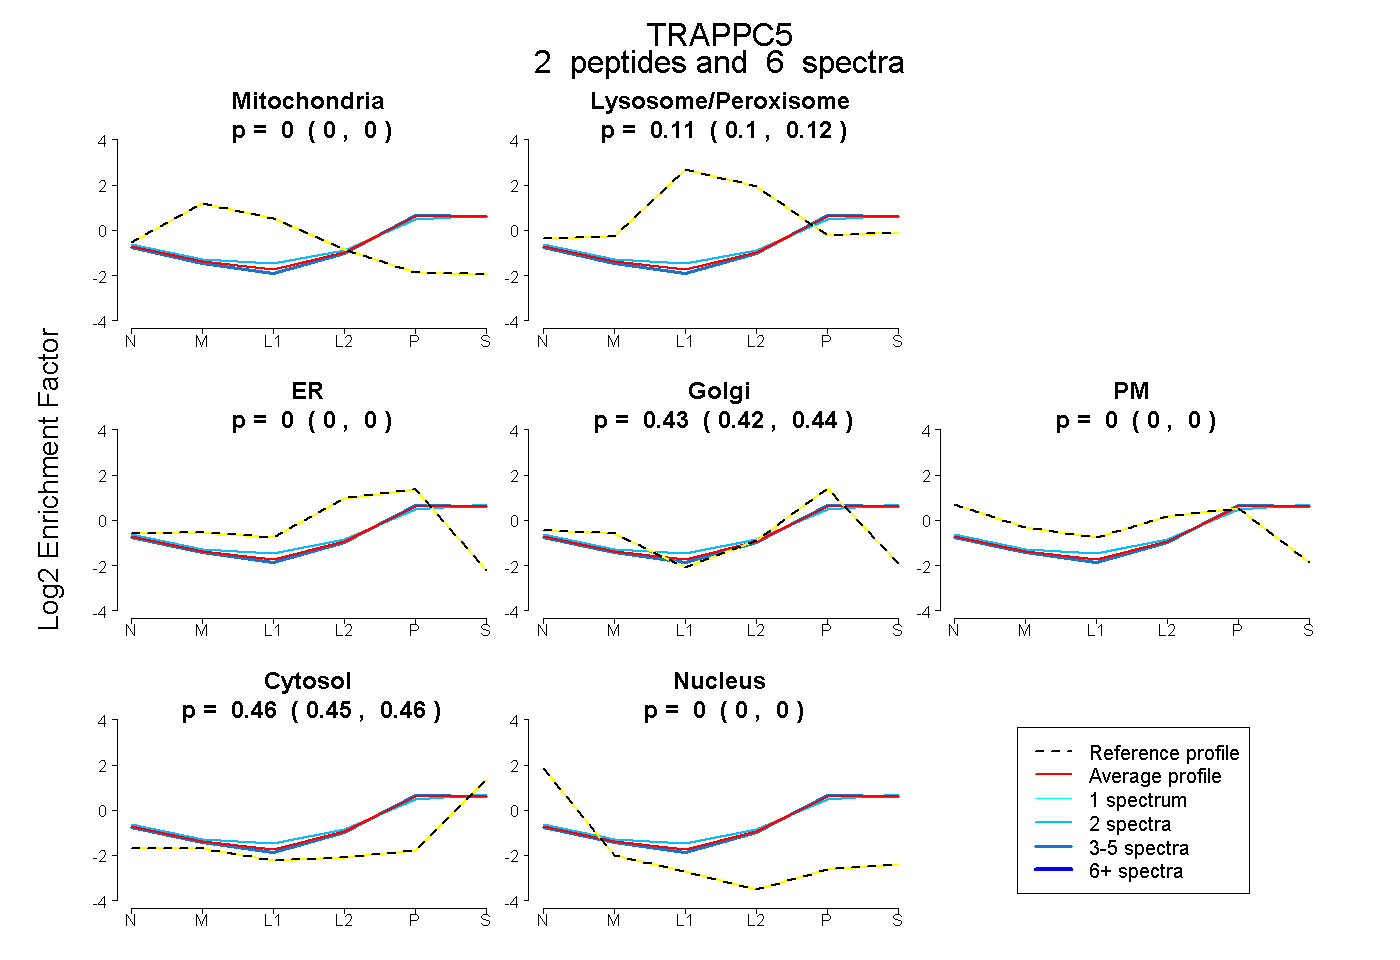
0.000 | 0.000
0.098 | 0.122
0.000 | 0.000
0.421 | 0.441
0.000 | 0.000
0.450 | 0.463
0.000 | 0.000
4peptides
spectra
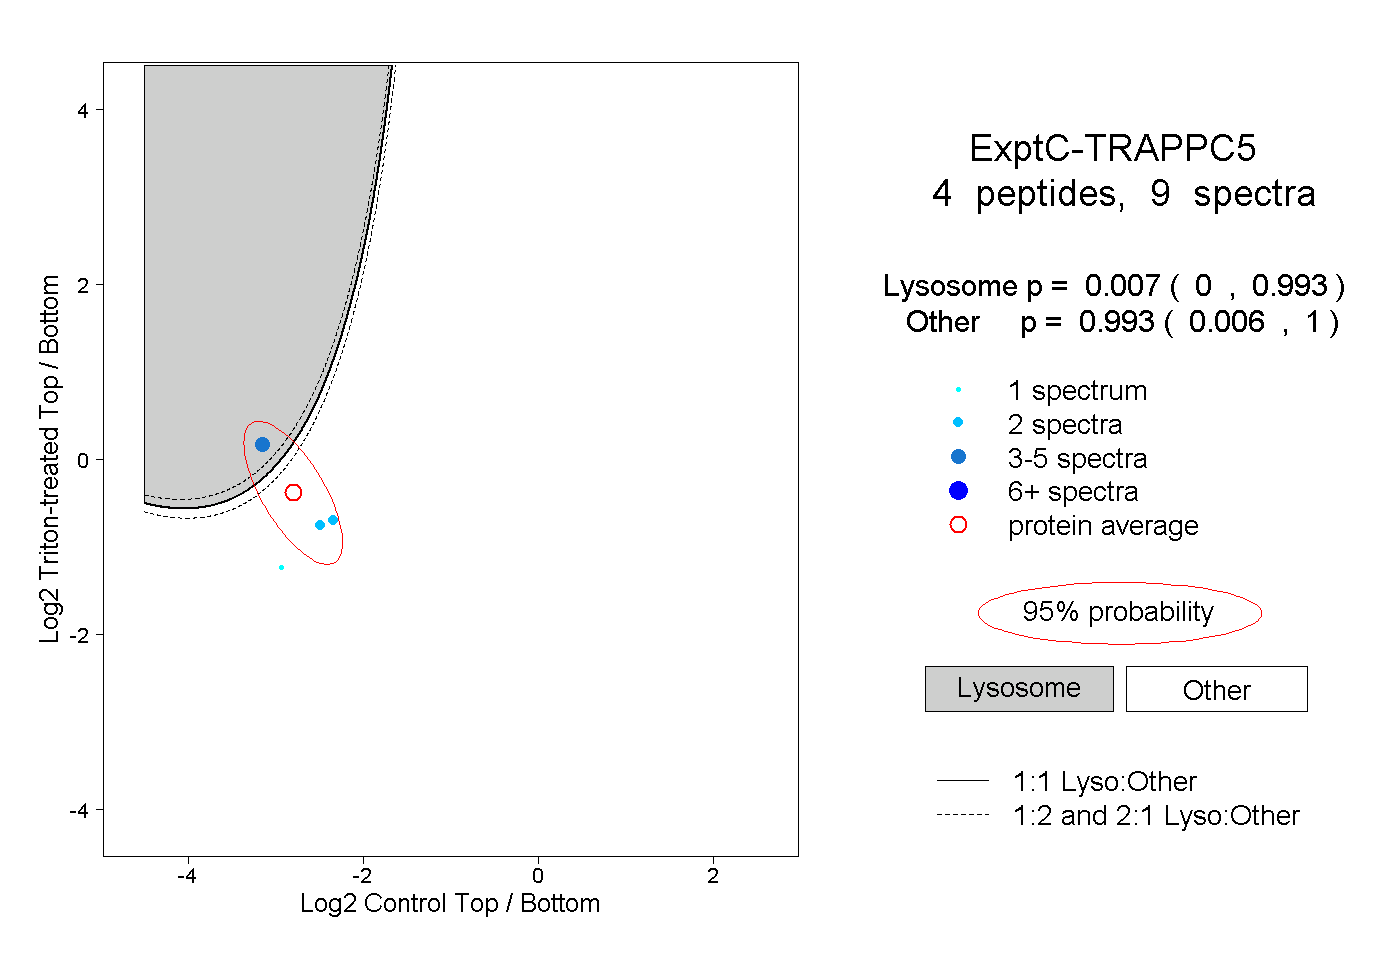
0.000 | 0.993
0.006 | 1.000