 6
6peptides
spectra
0.000 | 0.000
0.084 | 0.100
0.000 | 0.000
0.000 | 0.000
0.286 | 0.314
0.010 | 0.038
0.573 | 0.586
0.000 | 0.000
| Plot | Mito | Lyso | Perox | ER | Golgi | PM | Cytosol | Nucleus | |||||
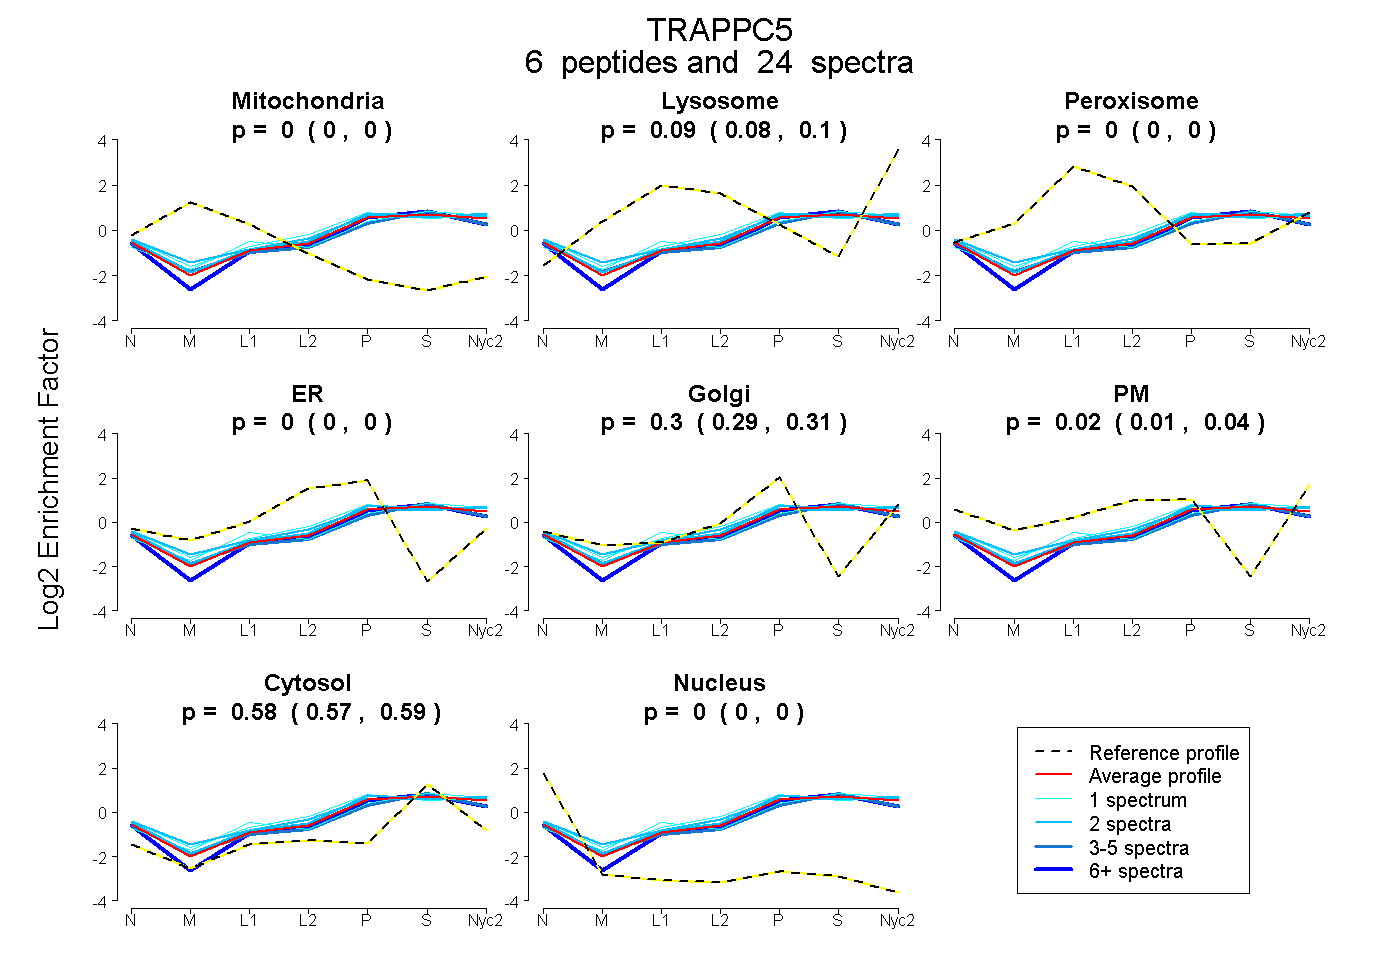
| Expt A |
6 peptides |
24 spectra |
|
0.000 0.000 | 0.000 |
0.093 0.084 | 0.100 |
0.000 0.000 | 0.000 |
0.000 0.000 | 0.000 |
0.302 0.286 | 0.314 |
0.025 0.010 | 0.038 |
0.580 0.573 | 0.586 |
0.000 0.000 | 0.000 |
| 2 spectra, VLDALVAR | 0.000 | 0.118 | 0.000 | 0.000 | 0.235 | 0.137 | 0.510 | 0.000 | ||
| 14 spectra, ALVRPR | 0.000 | 0.032 | 0.000 | 0.000 | 0.324 | 0.000 | 0.644 | 0.000 | ||
| 1 spectrum, LAALGR | 0.000 | 0.121 | 0.000 | 0.000 | 0.275 | 0.110 | 0.495 | 0.000 | ||
| 2 spectra, VFSVAELQAR | 0.000 | 0.103 | 0.000 | 0.000 | 0.323 | 0.036 | 0.538 | 0.000 | ||
| 4 spectra, FEEAVIAR | 0.000 | 0.068 | 0.000 | 0.000 | 0.241 | 0.050 | 0.641 | 0.000 | ||
| 1 spectrum, TFYIIER | 0.000 | 0.191 | 0.000 | 0.000 | 0.217 | 0.000 | 0.592 | 0.000 |
| Plot | Mito | Lyso or Perox | ER | Golgi | PM | Cytosol | Nucleus | ||||||
| Expt B |
2 peptides |
6 spectra |
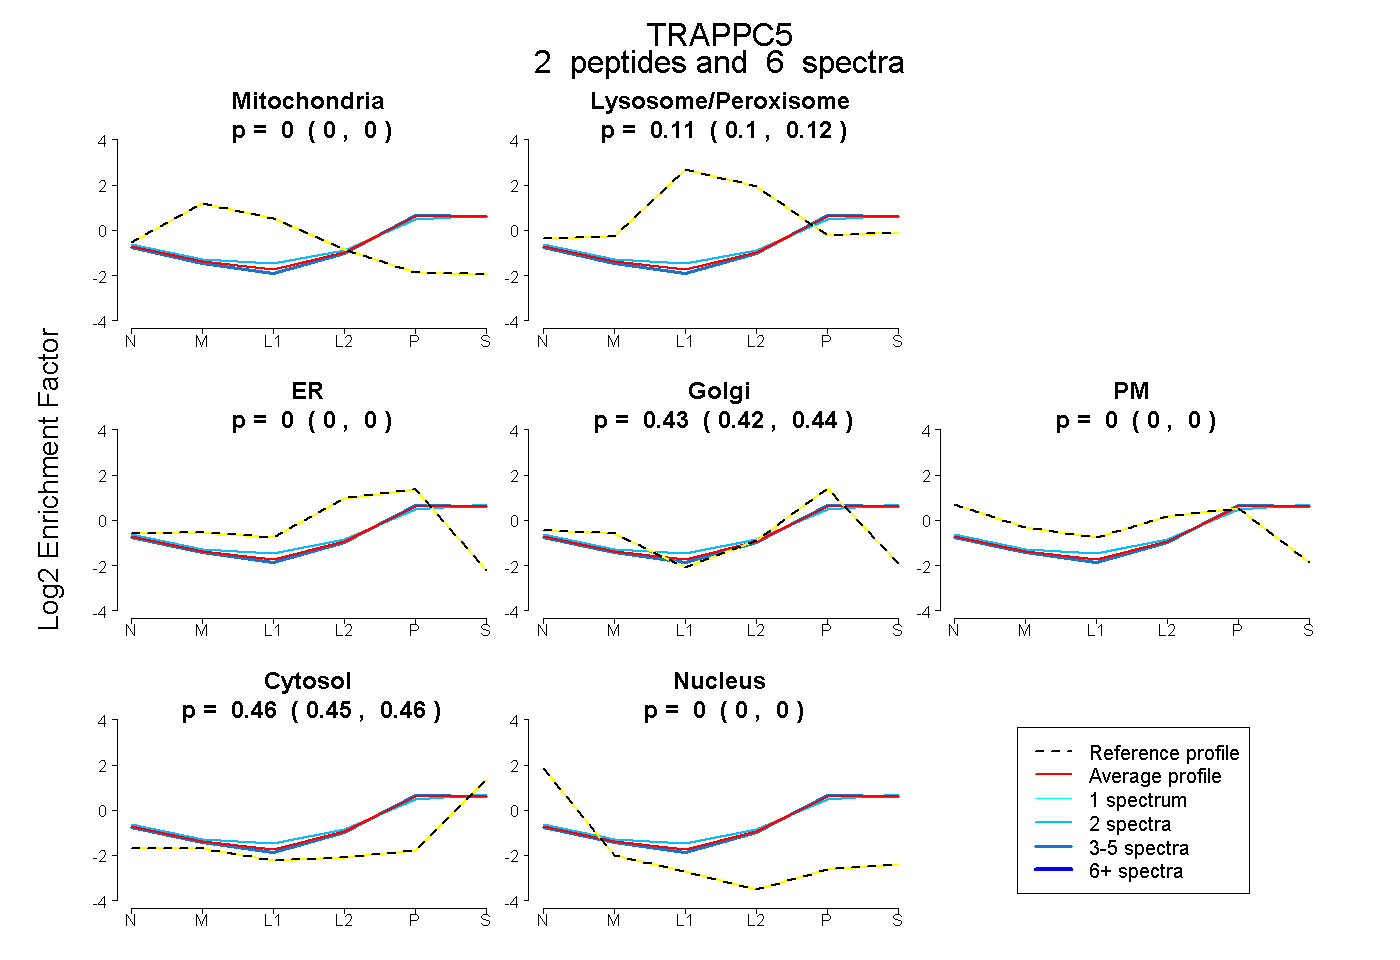 |
0.000 0.000 | 0.000 |
0.110 0.098 | 0.122 |
0.000 0.000 | 0.000 |
0.432 0.421 | 0.441 |
0.000 0.000 | 0.000 |
0.457 0.450 | 0.463 |
0.000 0.000 | 0.000 |
|||
| Plot | Lyso | Other | |||||||||||
| Expt C |
4 peptides |
9 spectra |
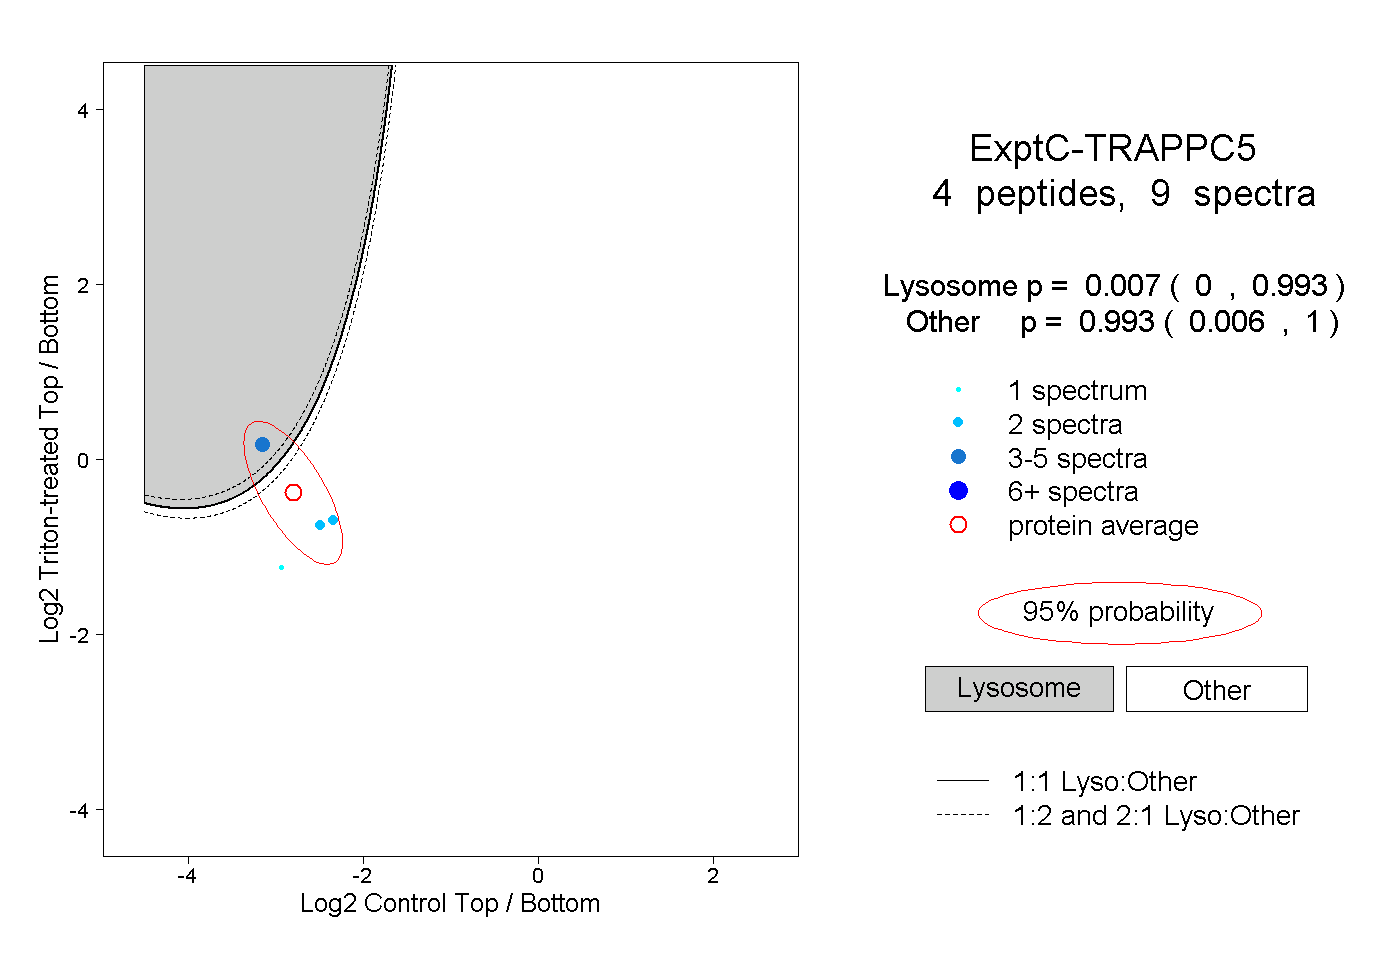 |
0.007 0.000 | 0.993 |
0.993 0.006 | 1.000 |