 9
9peptides
spectra
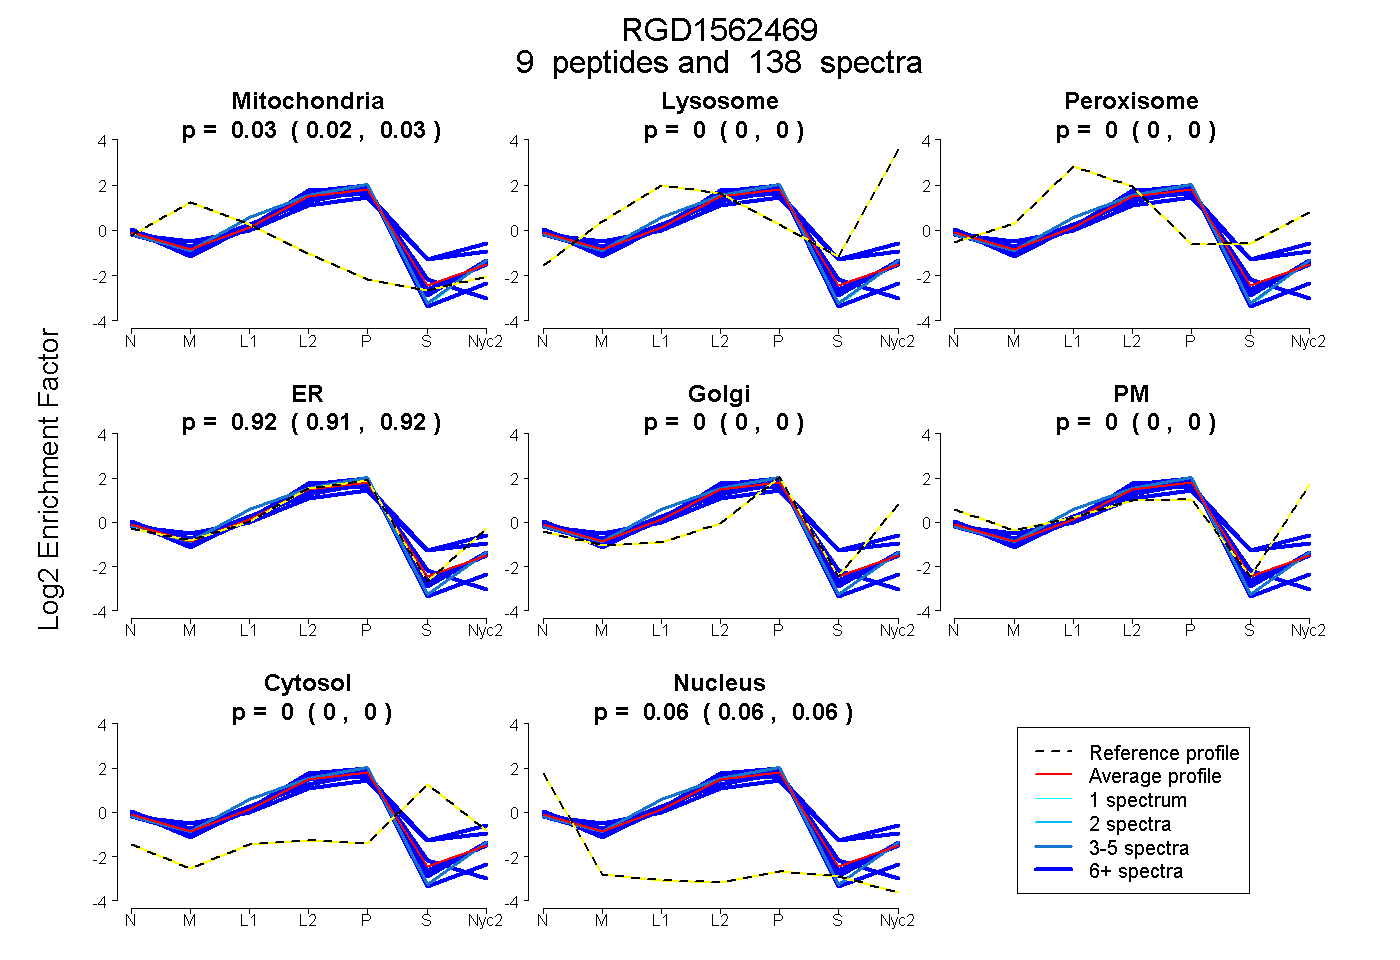
0.023 | 0.028
0.000 | 0.000
0.000 | 0.000
0.913 | 0.918
0.000 | 0.000
0.000 | 0.000
0.000 | 0.000
0.056 | 0.061
9peptides
spectra
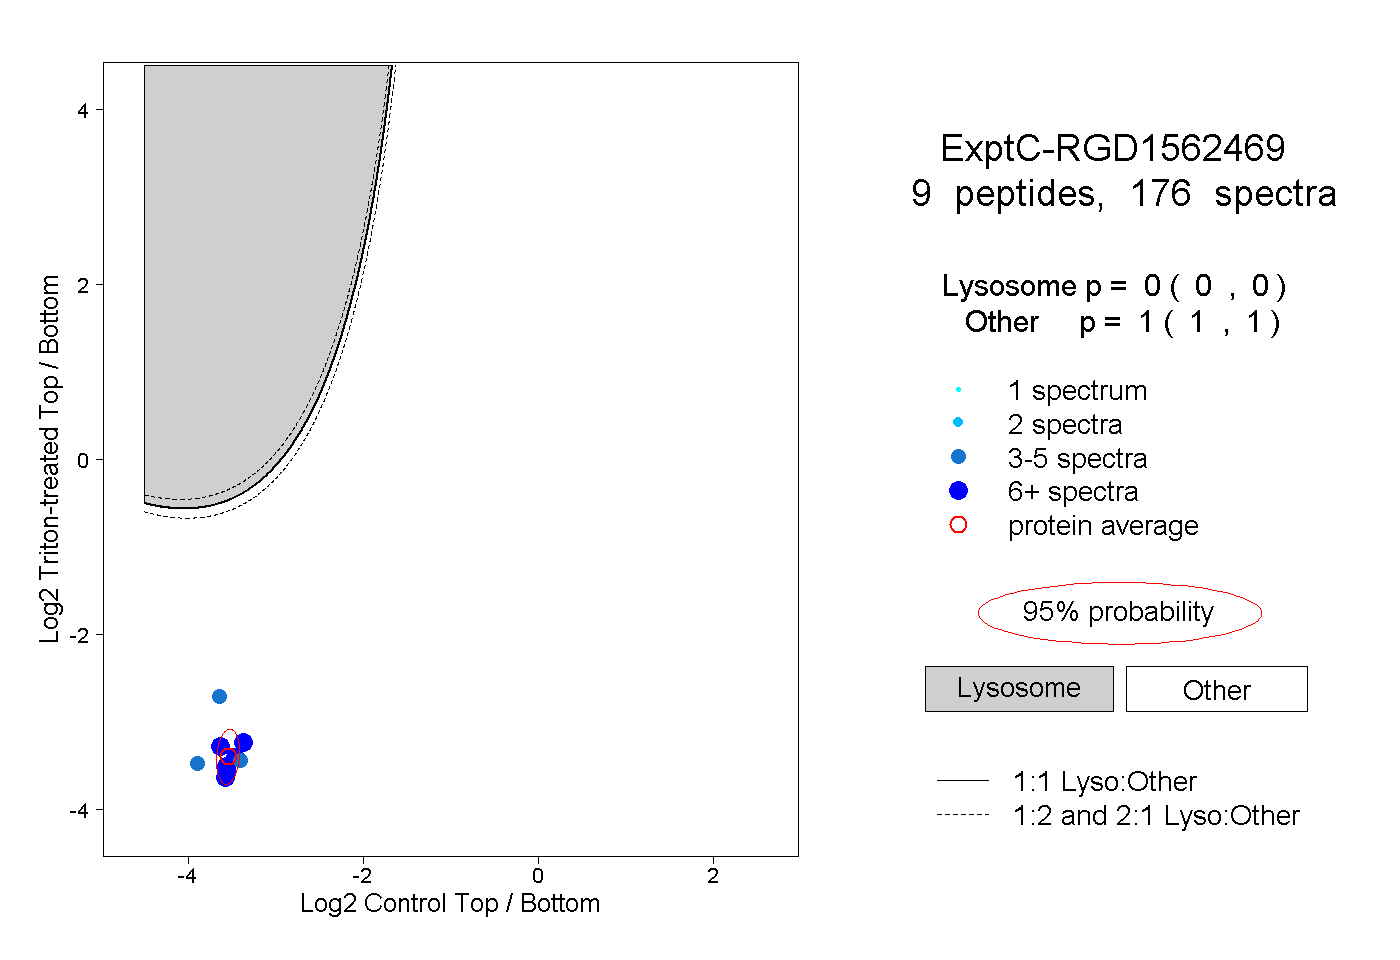
0.000 | 0.000
1.000 | 1.000
5peptides
spectra
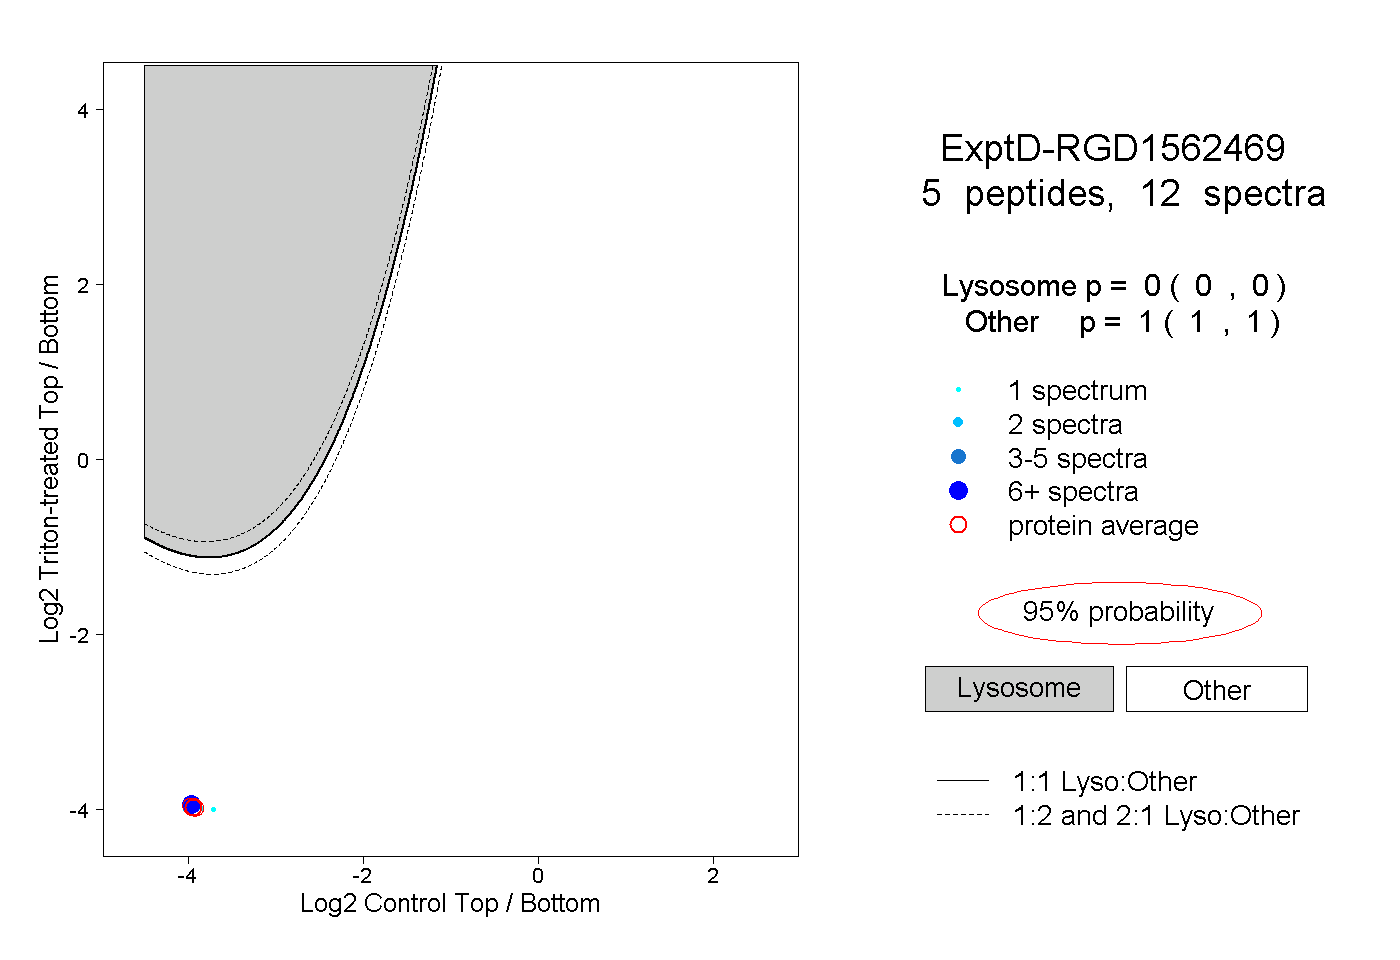
0.000 | 0.000
1.000 | 1.000