 9
9peptides
spectra
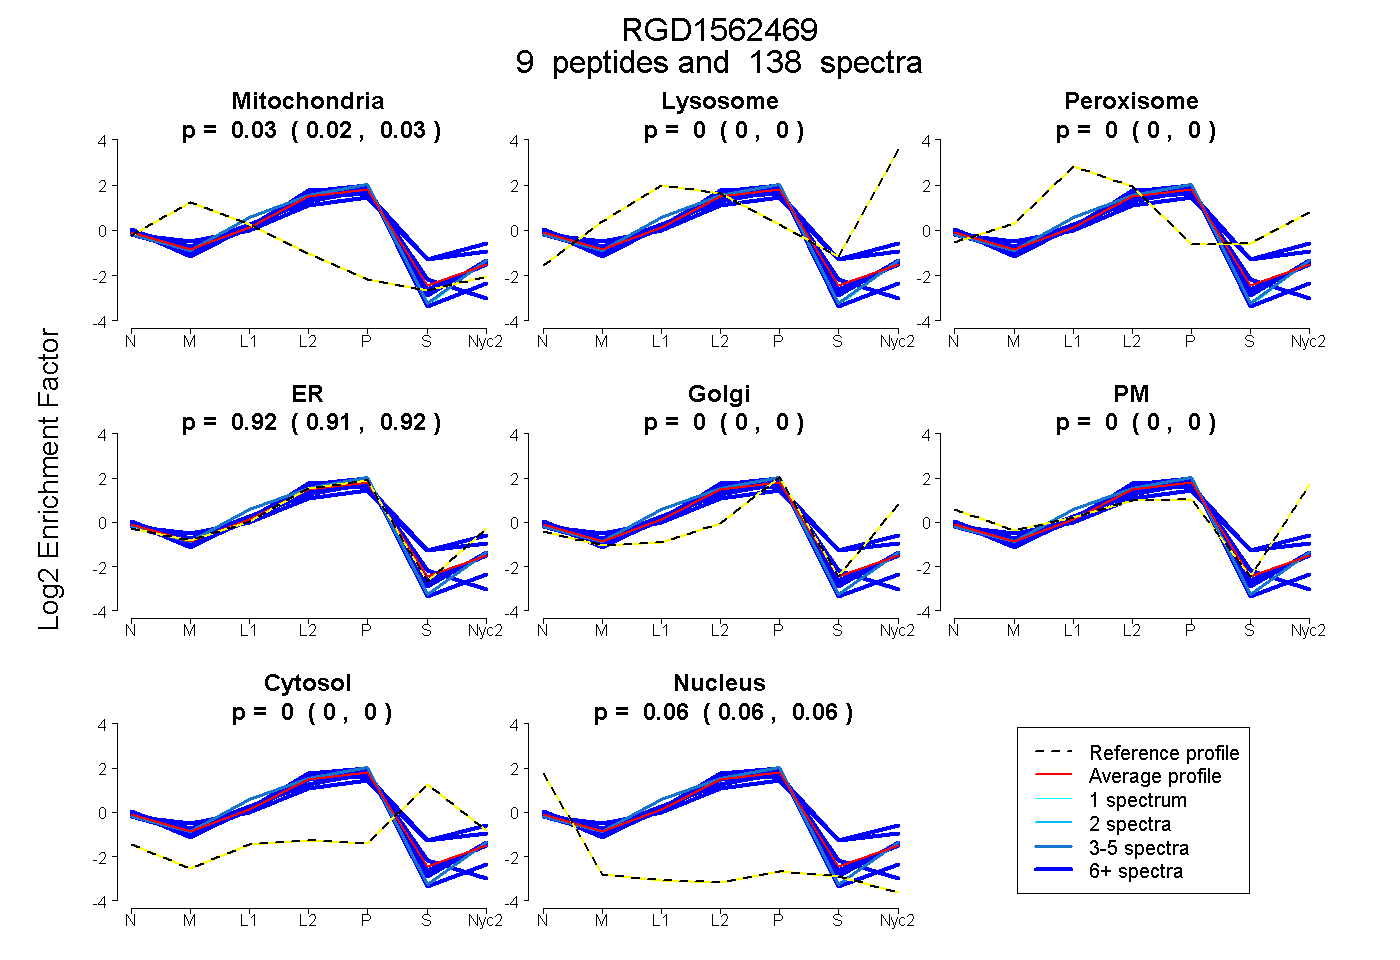
0.023 | 0.028
0.000 | 0.000
0.000 | 0.000
0.913 | 0.918
0.000 | 0.000
0.000 | 0.000
0.000 | 0.000
0.056 | 0.061
| Plot | Mito | Lyso | Perox | ER | Golgi | PM | Cytosol | Nucleus | |||||
| Expt A |
9 peptides |
138 spectra |
|
0.026 0.023 | 0.028 |
0.000 0.000 | 0.000 |
0.000 0.000 | 0.000 |
0.916 0.913 | 0.918 |
0.000 0.000 | 0.000 |
0.000 0.000 | 0.000 |
0.000 0.000 | 0.000 |
0.059 0.056 | 0.061 |
| 4 spectra, YMFSRPFR | 0.033 | 0.000 | 0.000 | 0.953 | 0.000 | 0.000 | 0.000 | 0.013 | ||
| 20 spectra, QPAPPR | 0.000 | 0.000 | 0.000 | 0.950 | 0.000 | 0.000 | 0.000 | 0.050 | ||
| 1 spectrum, DSFLK | 0.000 | 0.000 | 0.000 | 0.944 | 0.000 | 0.000 | 0.000 | 0.056 | ||
| 21 spectra, EAHFVR | 0.000 | 0.000 | 0.082 | 0.778 | 0.000 | 0.000 | 0.141 | 0.000 | ||
| 22 spectra, GMGTVQK | 0.000 | 0.000 | 0.000 | 0.937 | 0.000 | 0.000 | 0.000 | 0.063 | ||
| 6 spectra, VYNVTQHAVGIIVNK | 0.094 | 0.000 | 0.000 | 0.799 | 0.000 | 0.000 | 0.000 | 0.107 | ||
| 11 spectra, GDIVDIK | 0.000 | 0.000 | 0.000 | 0.905 | 0.000 | 0.000 | 0.000 | 0.095 | ||
| 10 spectra, GTWVQLK | 0.004 | 0.000 | 0.000 | 0.932 | 0.000 | 0.000 | 0.000 | 0.064 | ||
| 43 spectra, HGVVPLATYMR | 0.008 | 0.000 | 0.097 | 0.728 | 0.000 | 0.000 | 0.167 | 0.000 |
| Plot | Lyso | Other | |||||||||||
| Expt C |
9 peptides |
176 spectra |
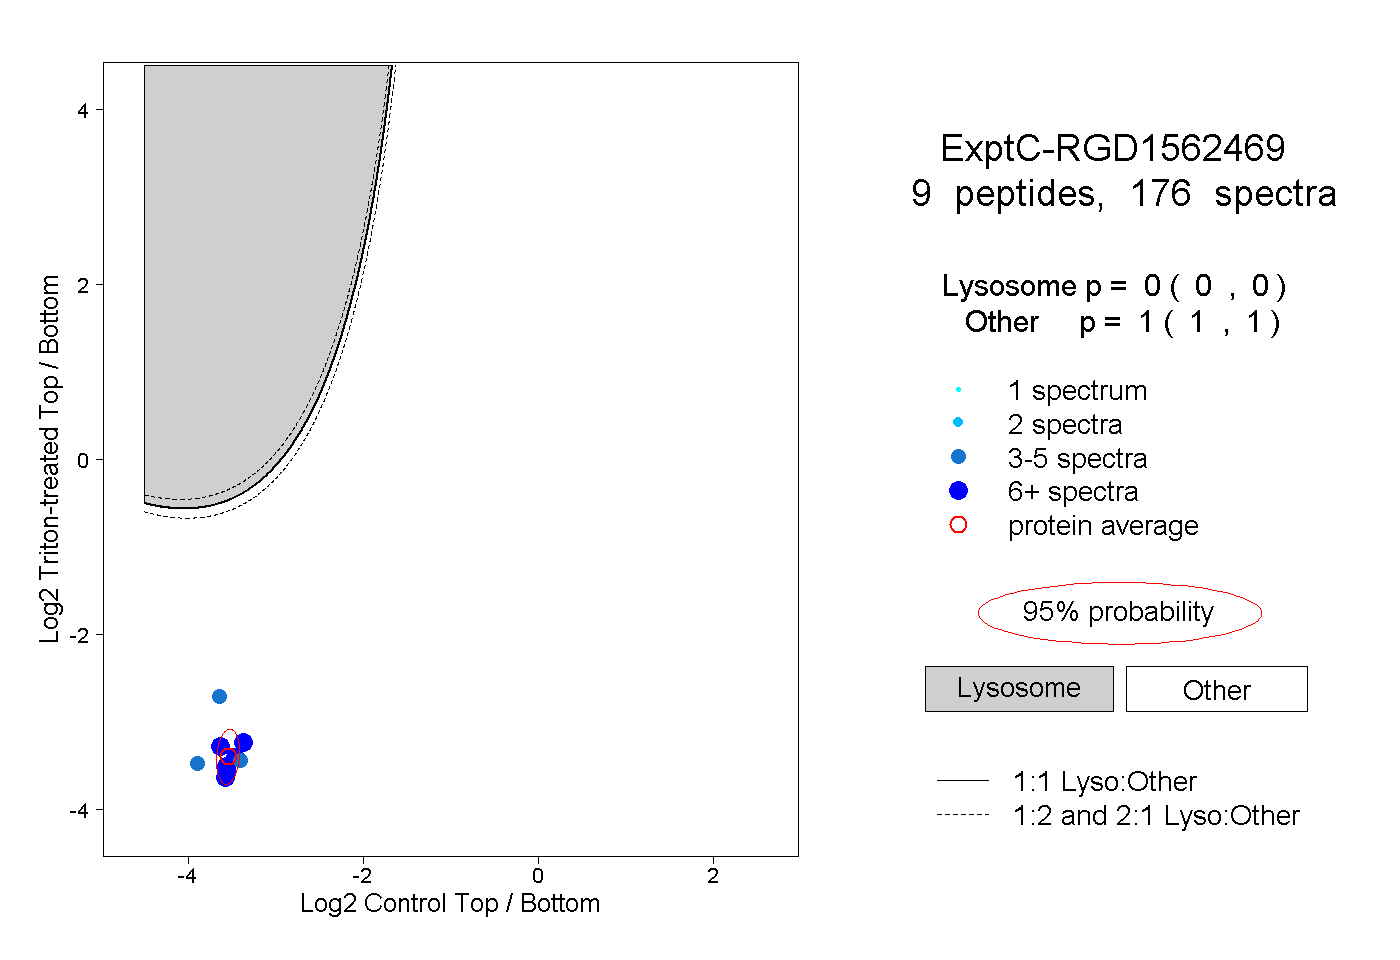 |
0.000 0.000 | 0.000 |
1.000 1.000 | 1.000 |
||||||||
| Plot | Lyso | Other | |||||||||||
| Expt D |
5 peptides |
12 spectra |
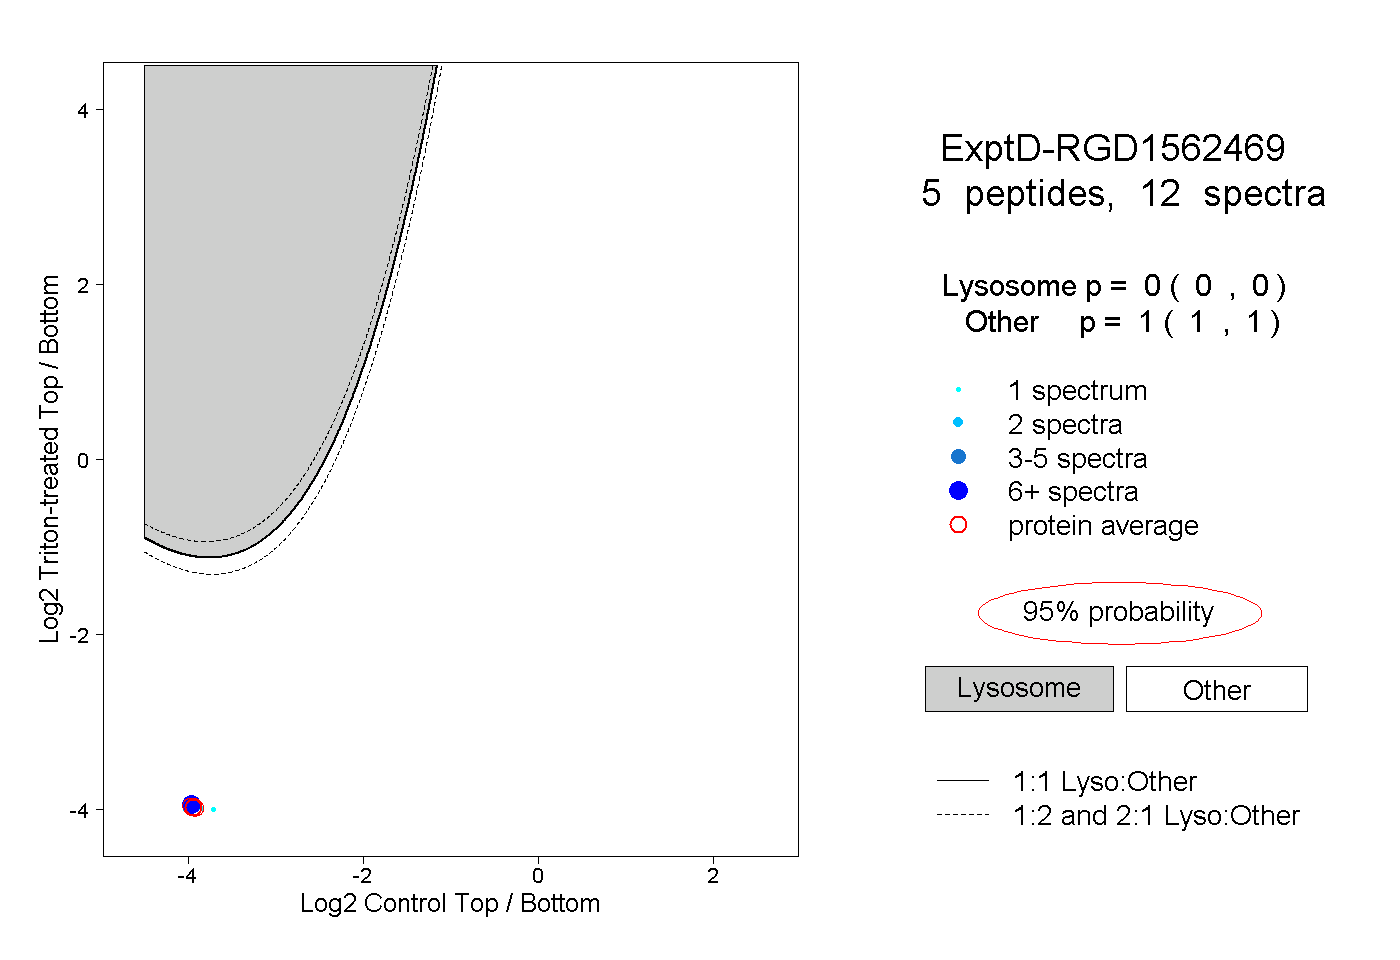 |
0.000 0.000 | 0.000 |
1.000 1.000 | 1.000 |