 8
8peptides
spectra
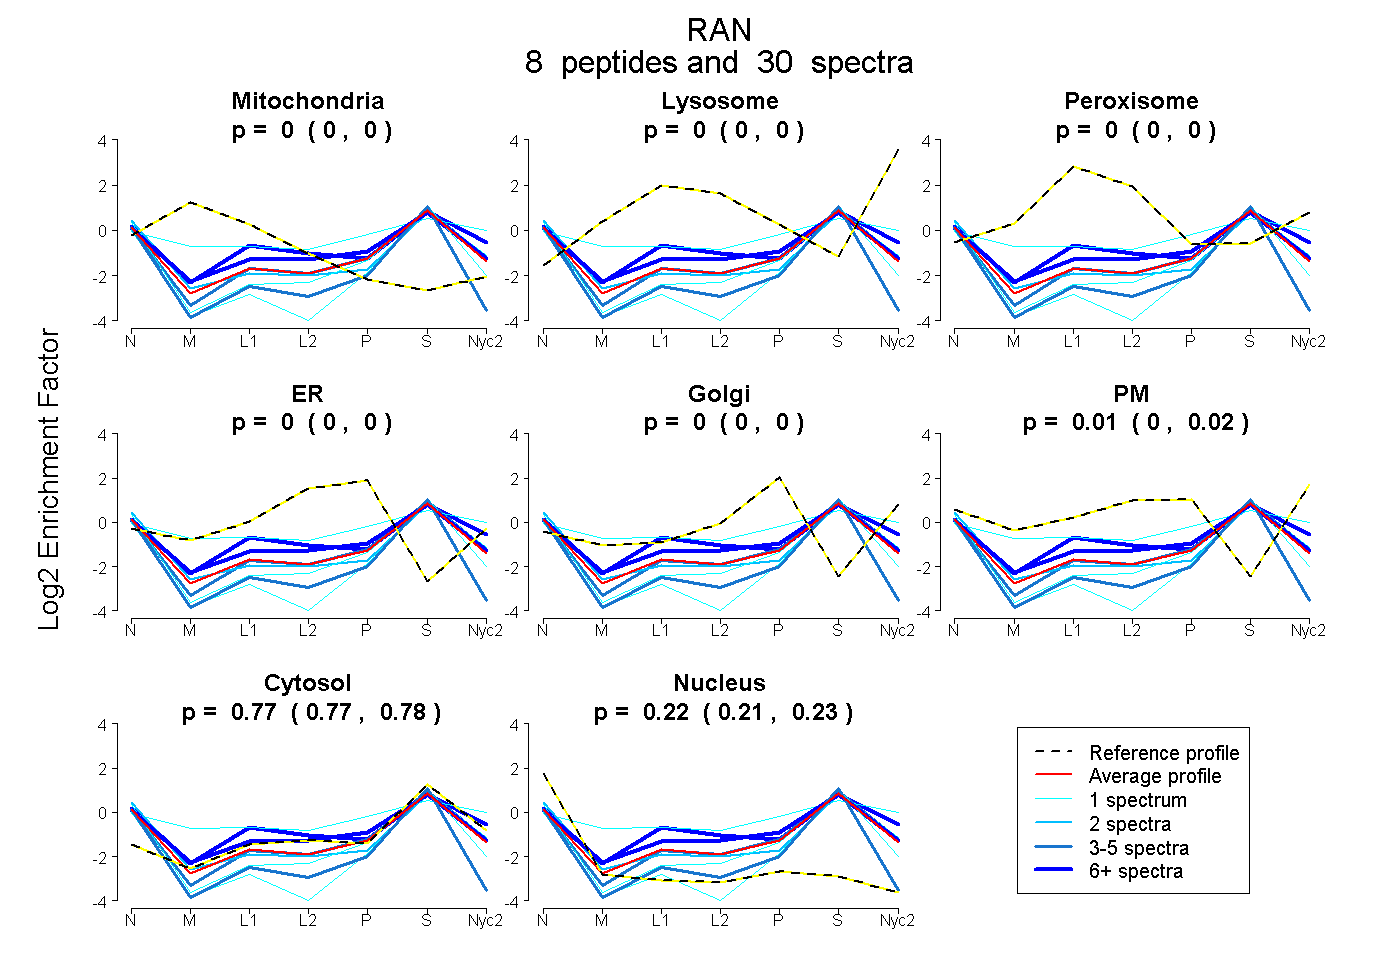
0.000 | 0.000
0.000 | 0.000
0.000 | 0.000
0.000 | 0.000
0.000 | 0.000
0.000 | 0.018
0.765 | 0.776
0.210 | 0.231
6peptides
spectra
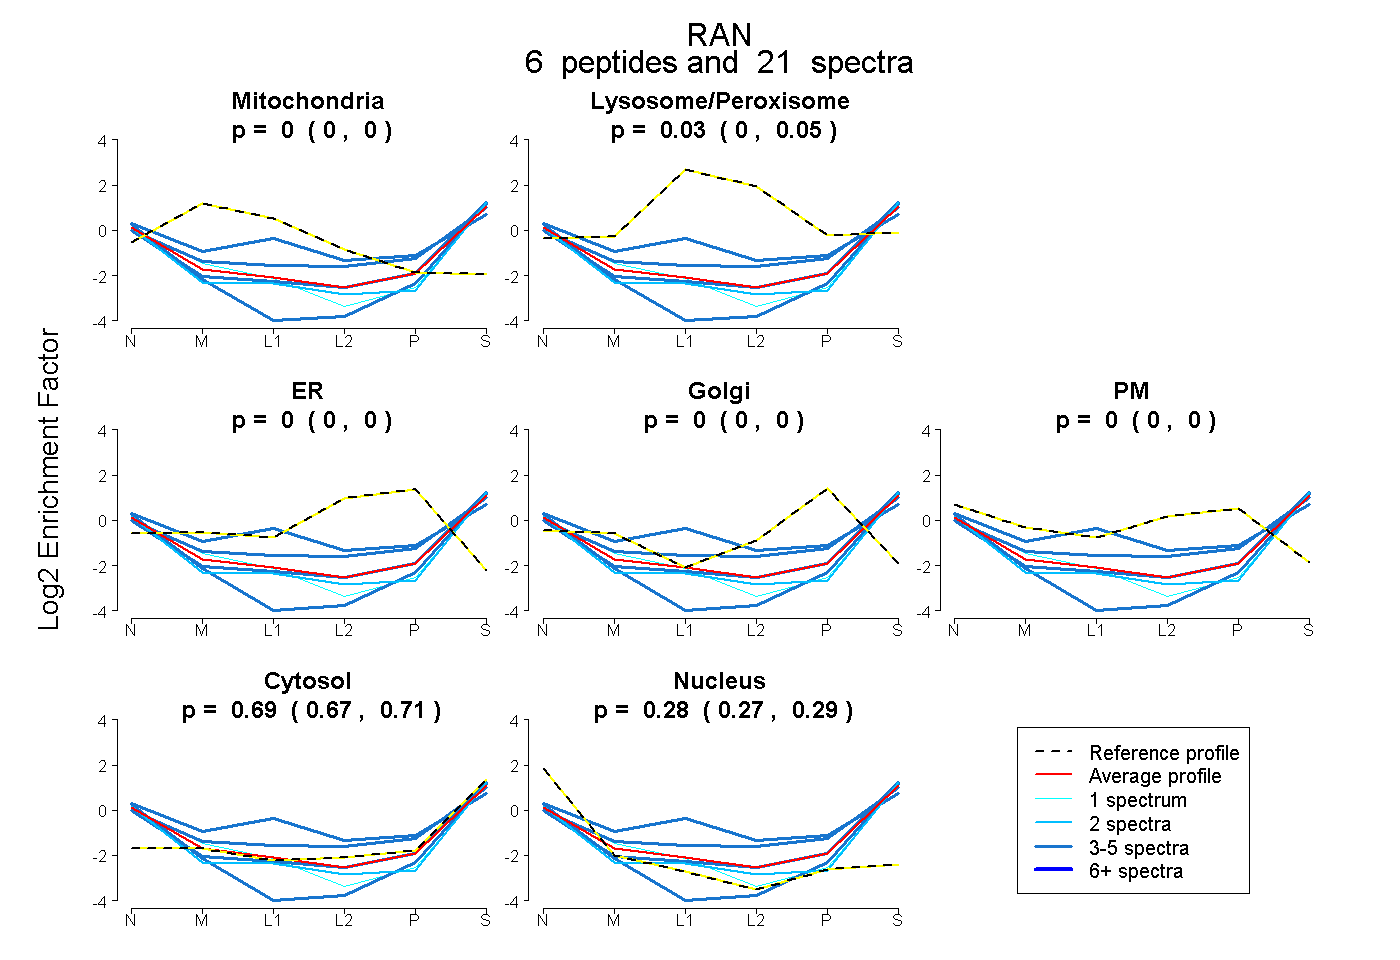
0.000 | 0.000
0.000 | 0.049
0.000 | 0.000
0.000 | 0.000
0.000 | 0.000
0.671 | 0.710
0.268 | 0.290
4peptides
spectra
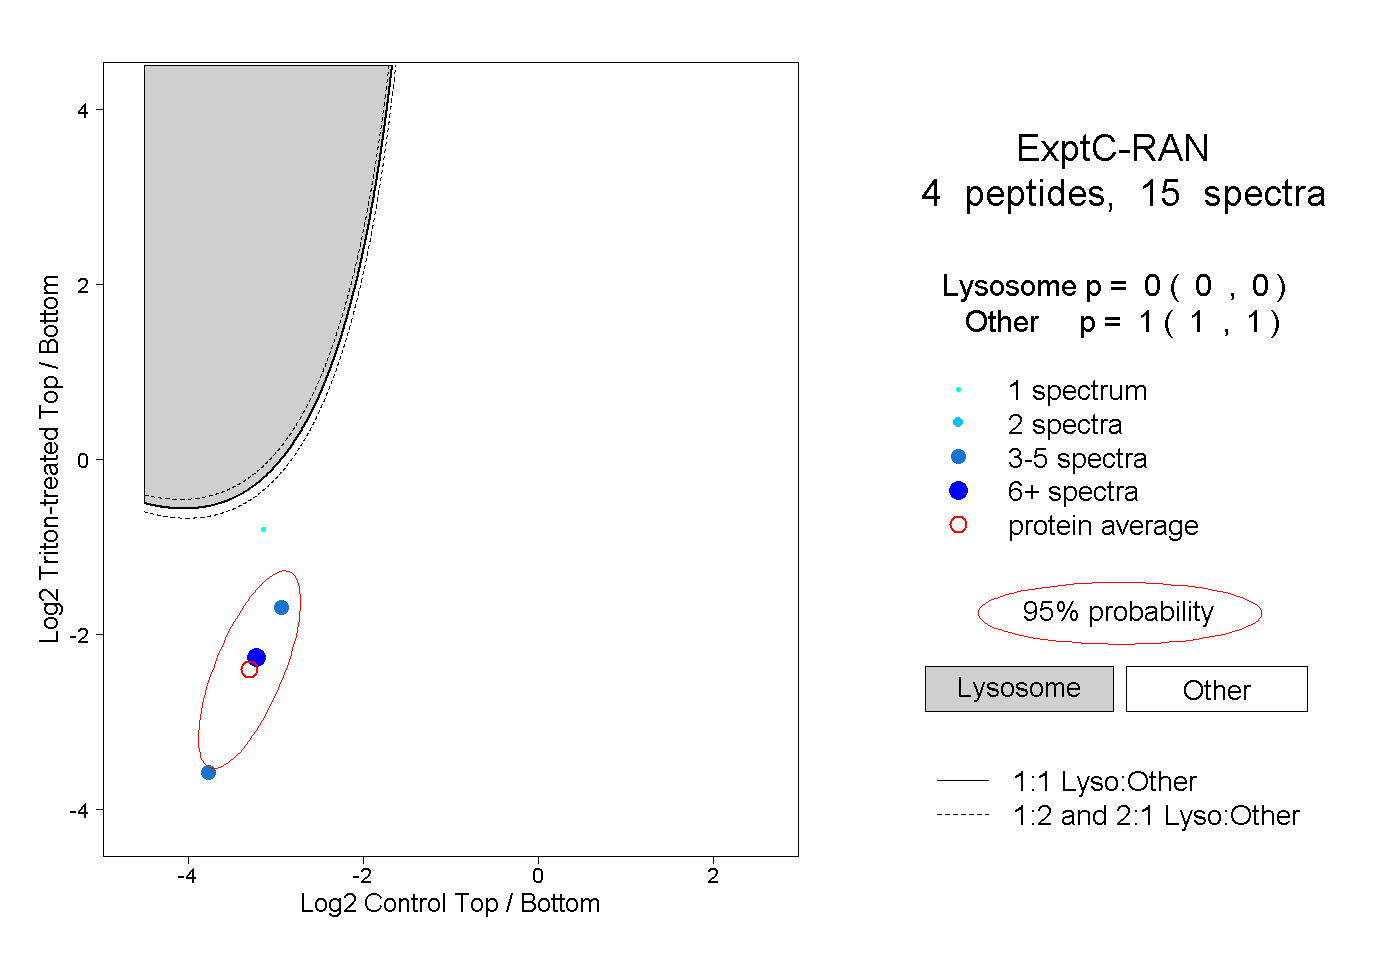
0.000 | 0.000
1.000 | 1.000
1peptide
spectrum
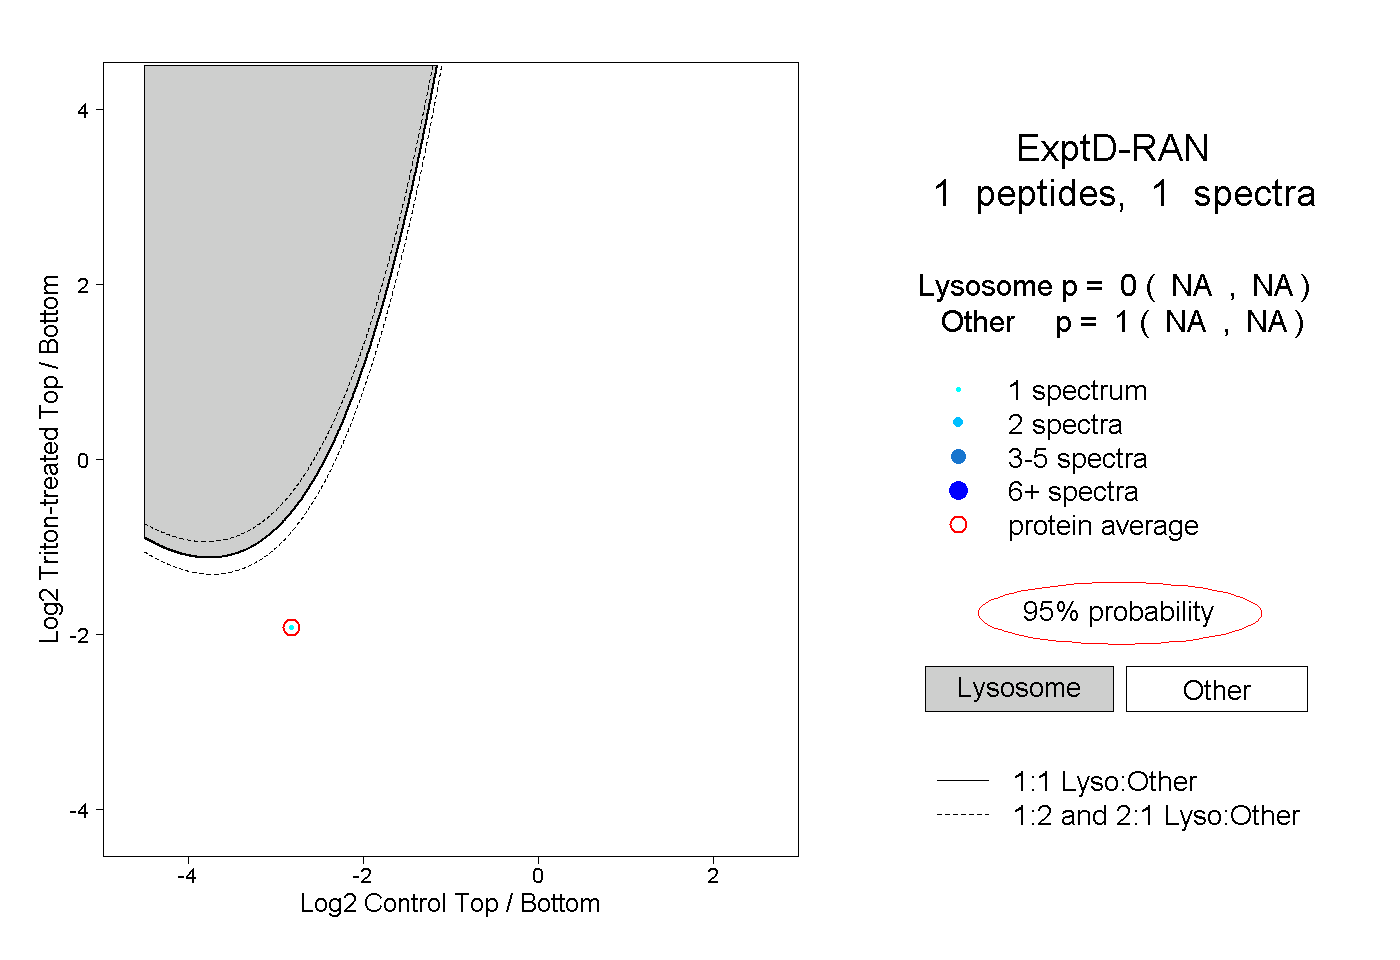
NA | NA
NA | NA