 8
8peptides
spectra
0.000 | 0.000
0.000 | 0.000
0.000 | 0.000
0.000 | 0.000
0.000 | 0.000
0.000 | 0.018
0.765 | 0.776
0.210 | 0.231
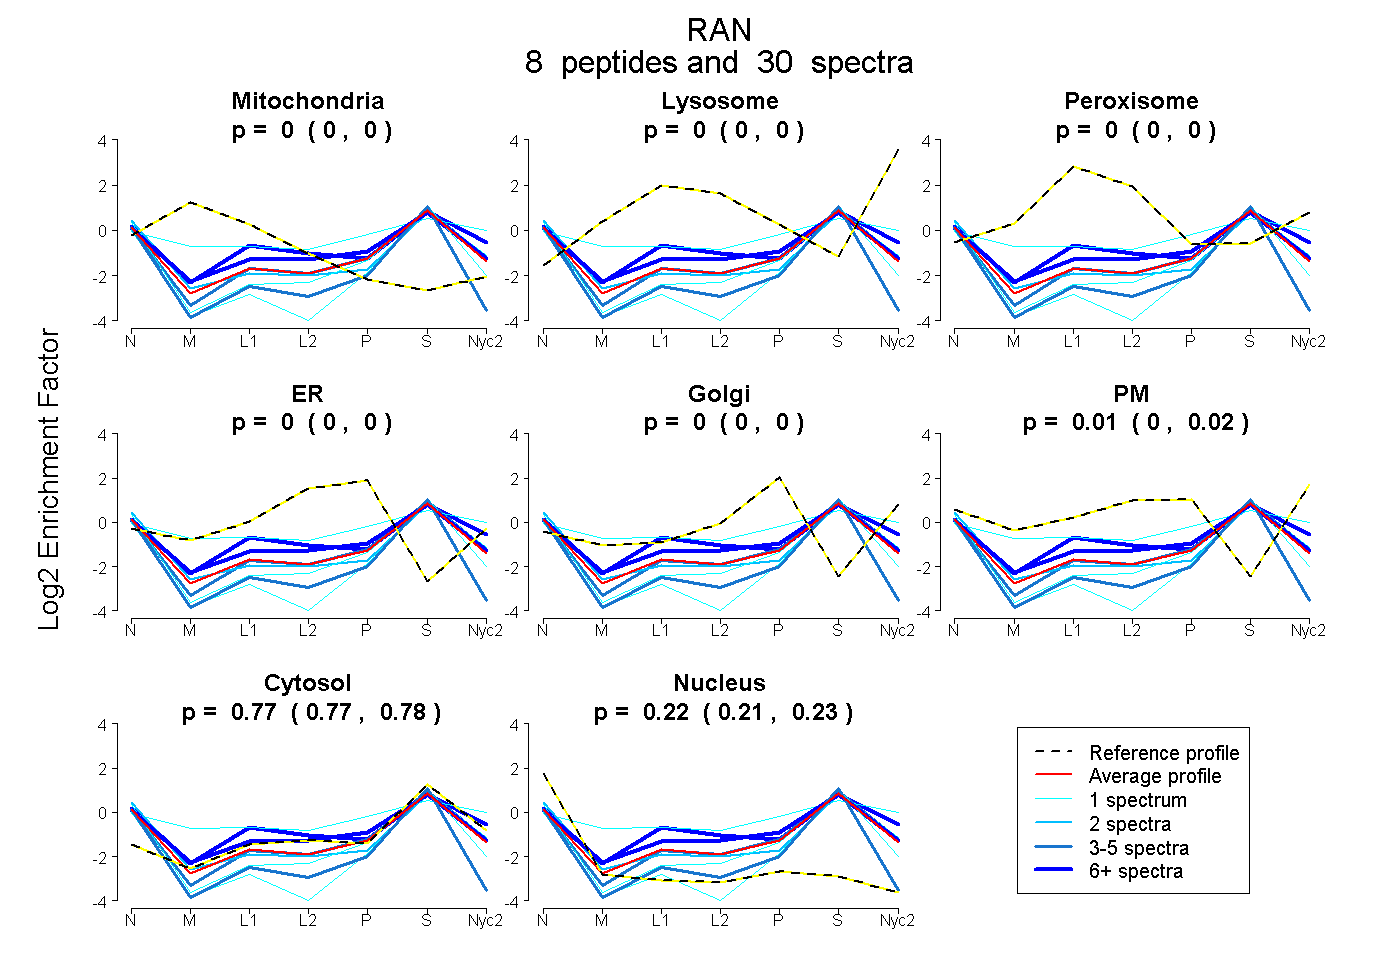
| Plot | Mito | Lyso | Perox | ER | Golgi | PM | Cytosol | Nucleus | |||||
| Expt A |
8 peptides |
30 spectra |
|
0.000 0.000 | 0.000 |
0.000 0.000 | 0.000 |
0.000 0.000 | 0.000 |
0.000 0.000 | 0.000 |
0.000 0.000 | 0.000 |
0.007 0.000 | 0.018 |
0.771 0.765 | 0.776 |
0.221 0.210 | 0.231 |
| 2 spectra, NLQYYDISAK | 0.000 | 0.000 | 0.000 | 0.000 | 0.000 | 0.002 | 0.729 | 0.268 | ||
| 1 spectrum, LVLVGDGGTGK | 0.061 | 0.000 | 0.037 | 0.000 | 0.000 | 0.327 | 0.575 | 0.000 | ||
| 3 spectra, VCENIPIVLCGNK | 0.000 | 0.000 | 0.000 | 0.000 | 0.000 | 0.000 | 0.554 | 0.446 | ||
| 1 spectrum, SNYNFEKPFLWLAR | 0.000 | 0.000 | 0.000 | 0.000 | 0.000 | 0.000 | 0.611 | 0.389 | ||
| 1 spectrum, NVPNWHR | 0.000 | 0.000 | 0.000 | 0.000 | 0.000 | 0.000 | 0.728 | 0.272 | ||
| 4 spectra, HLTGEFEK | 0.000 | 0.000 | 0.000 | 0.000 | 0.000 | 0.000 | 0.792 | 0.208 | ||
| 8 spectra, FNVWDTAGQEK | 0.000 | 0.000 | 0.144 | 0.000 | 0.000 | 0.064 | 0.675 | 0.117 | ||
| 10 spectra, SIVFHR | 0.000 | 0.000 | 0.042 | 0.003 | 0.000 | 0.076 | 0.716 | 0.163 |
| Plot | Mito | Lyso or Perox | ER | Golgi | PM | Cytosol | Nucleus | ||||||
| Expt B |
6 peptides |
21 spectra |
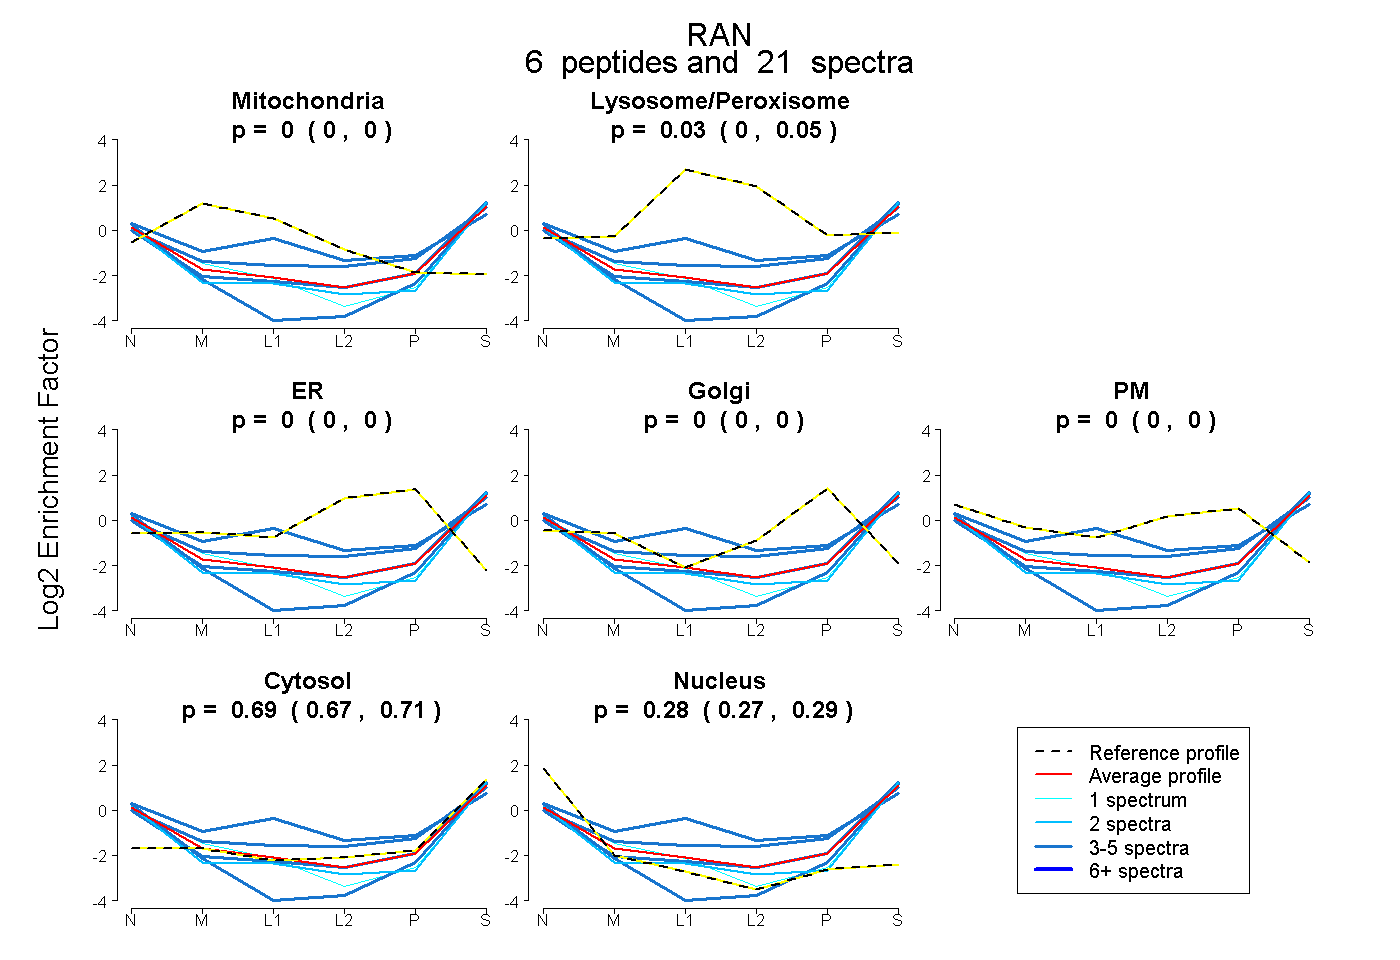 |
0.000 0.000 | 0.000 |
0.026 0.000 | 0.049 |
0.000 0.000 | 0.000 |
0.000 0.000 | 0.000 |
0.000 0.000 | 0.000 |
0.694 0.671 | 0.710 |
0.281 0.268 | 0.290 |
|||
| Plot | Lyso | Other | |||||||||||
| Expt C |
4 peptides |
15 spectra |
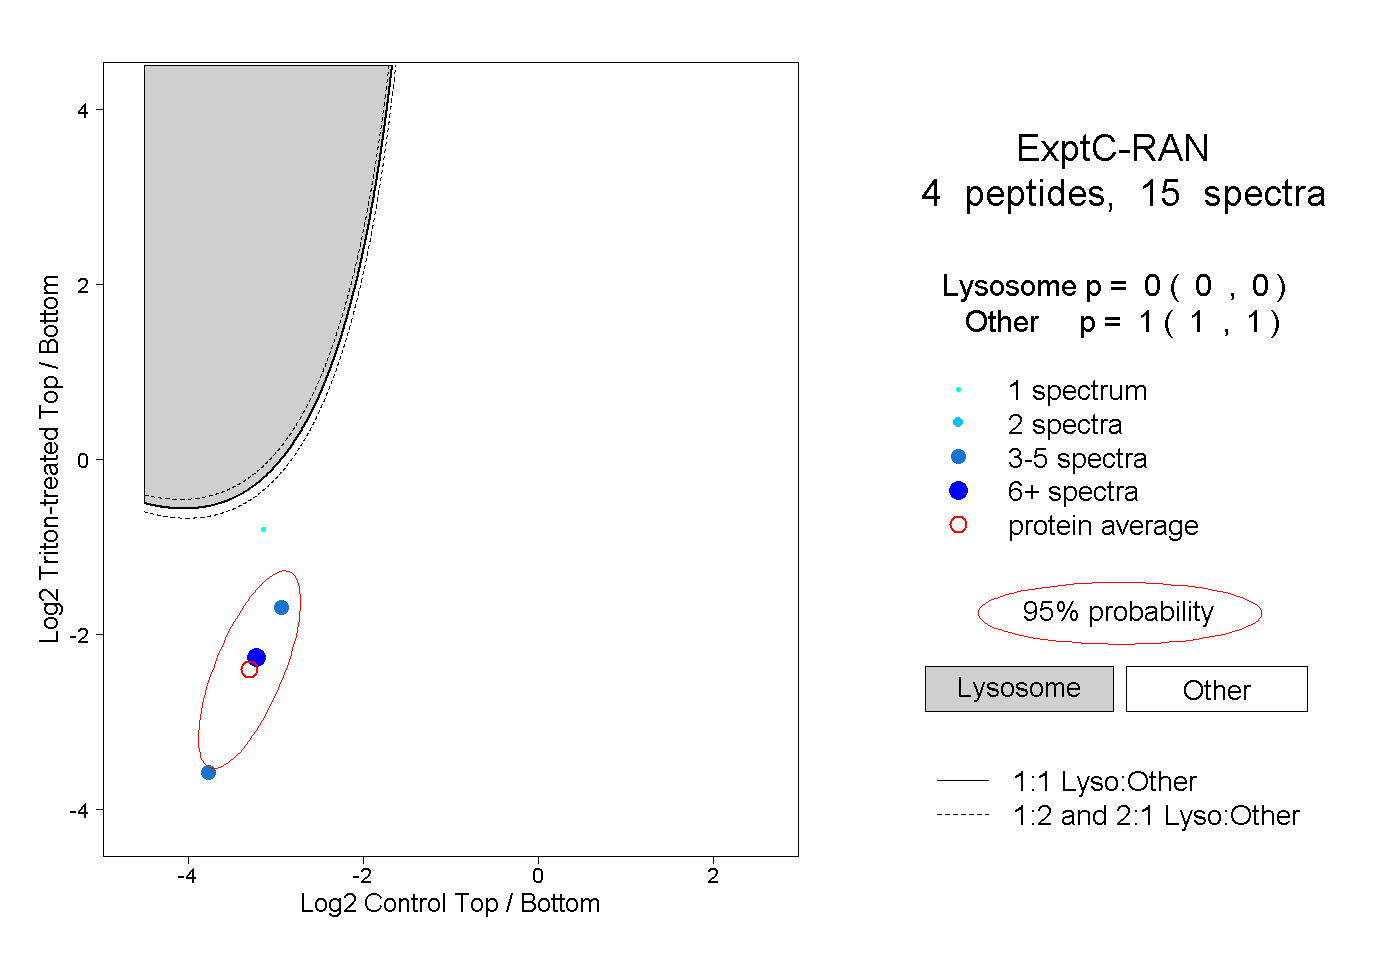 |
0.000 0.000 | 0.000 |
1.000 1.000 | 1.000 |
||||||||
| Plot | Lyso | Other | |||||||||||
| Expt D |
1 peptide |
1 spectrum |
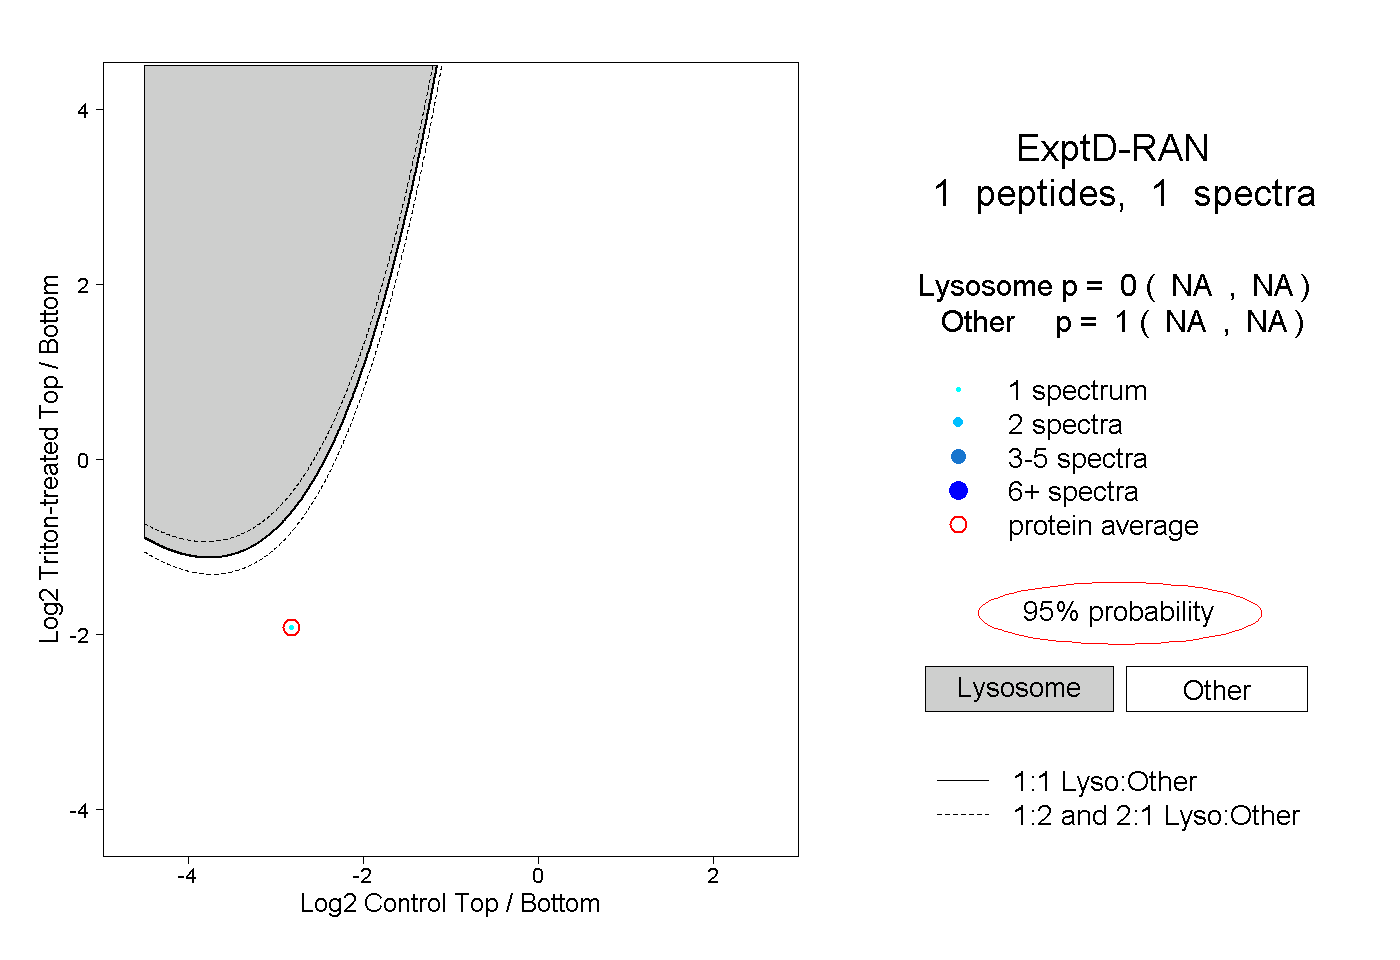 |
0.000 NA | NA |
1.000 NA | NA |