 5
5peptides
spectra
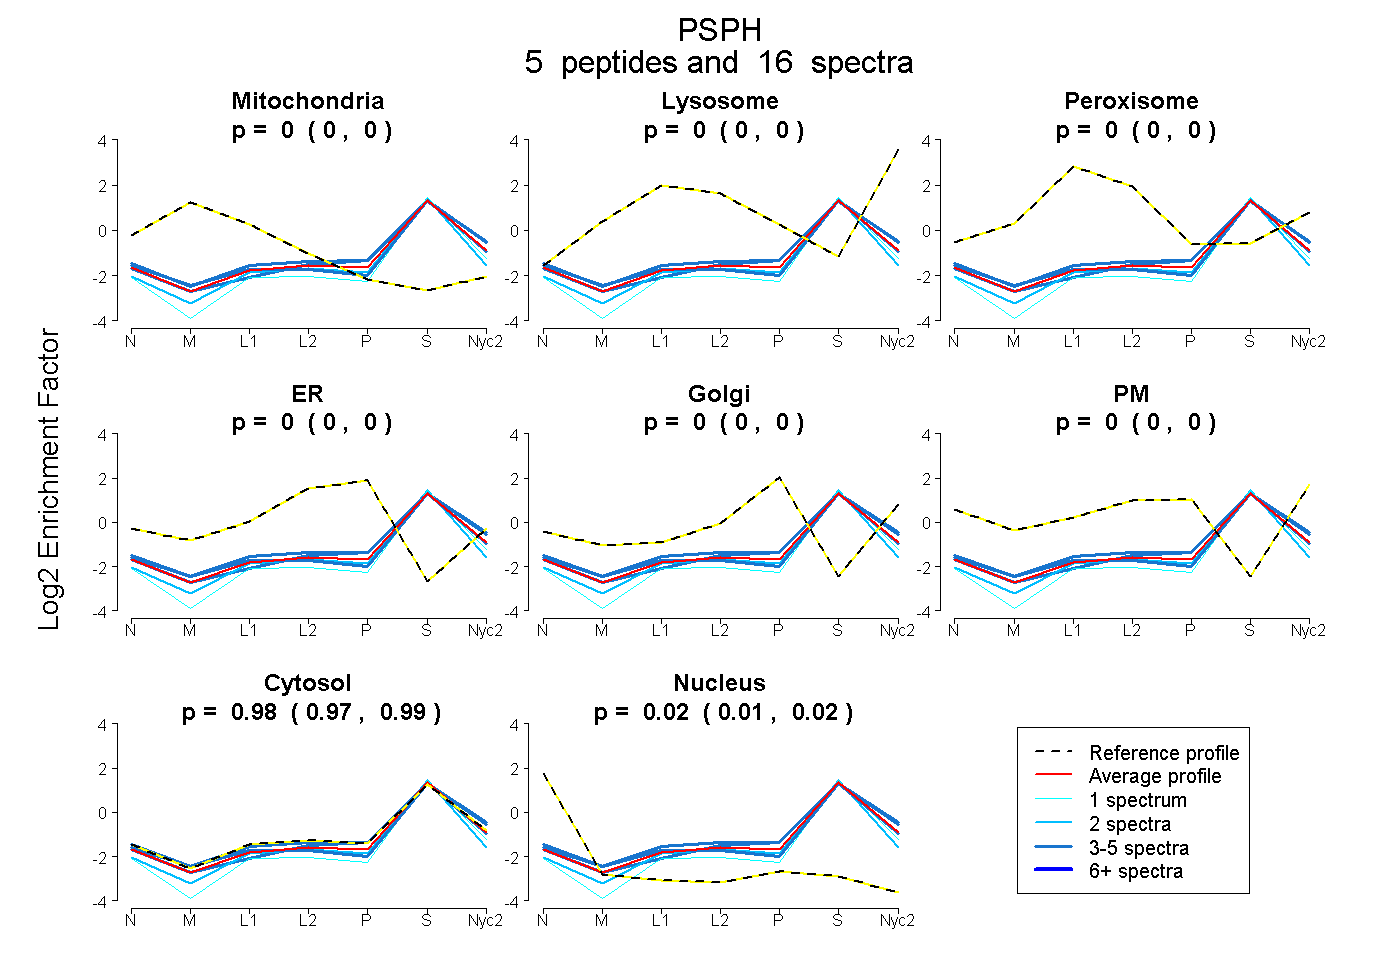
0.000 | 0.000
0.000 | 0.000
0.000 | 0.000
0.000 | 0.000
0.000 | 0.000
0.000 | 0.000
0.975 | 0.993
0.006 | 0.024
1peptide
spectra
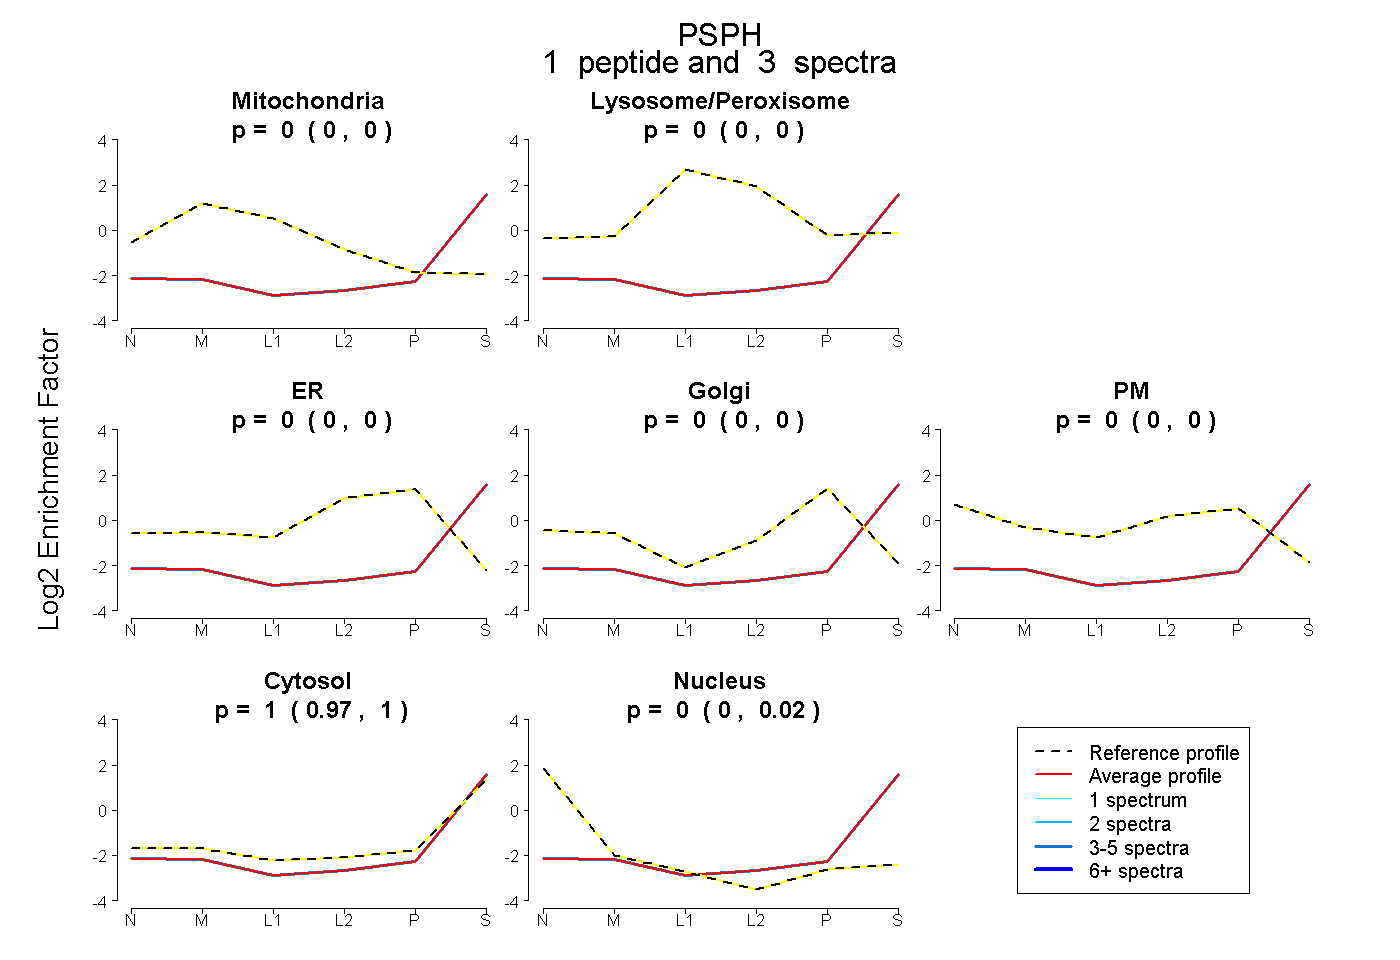
0.000 | 0.000
0.000 | 0.000
0.000 | 0.000
0.000 | 0.000
0.000 | 0.000
0.972 | 1.000
0.000 | 0.018
2peptides
spectra
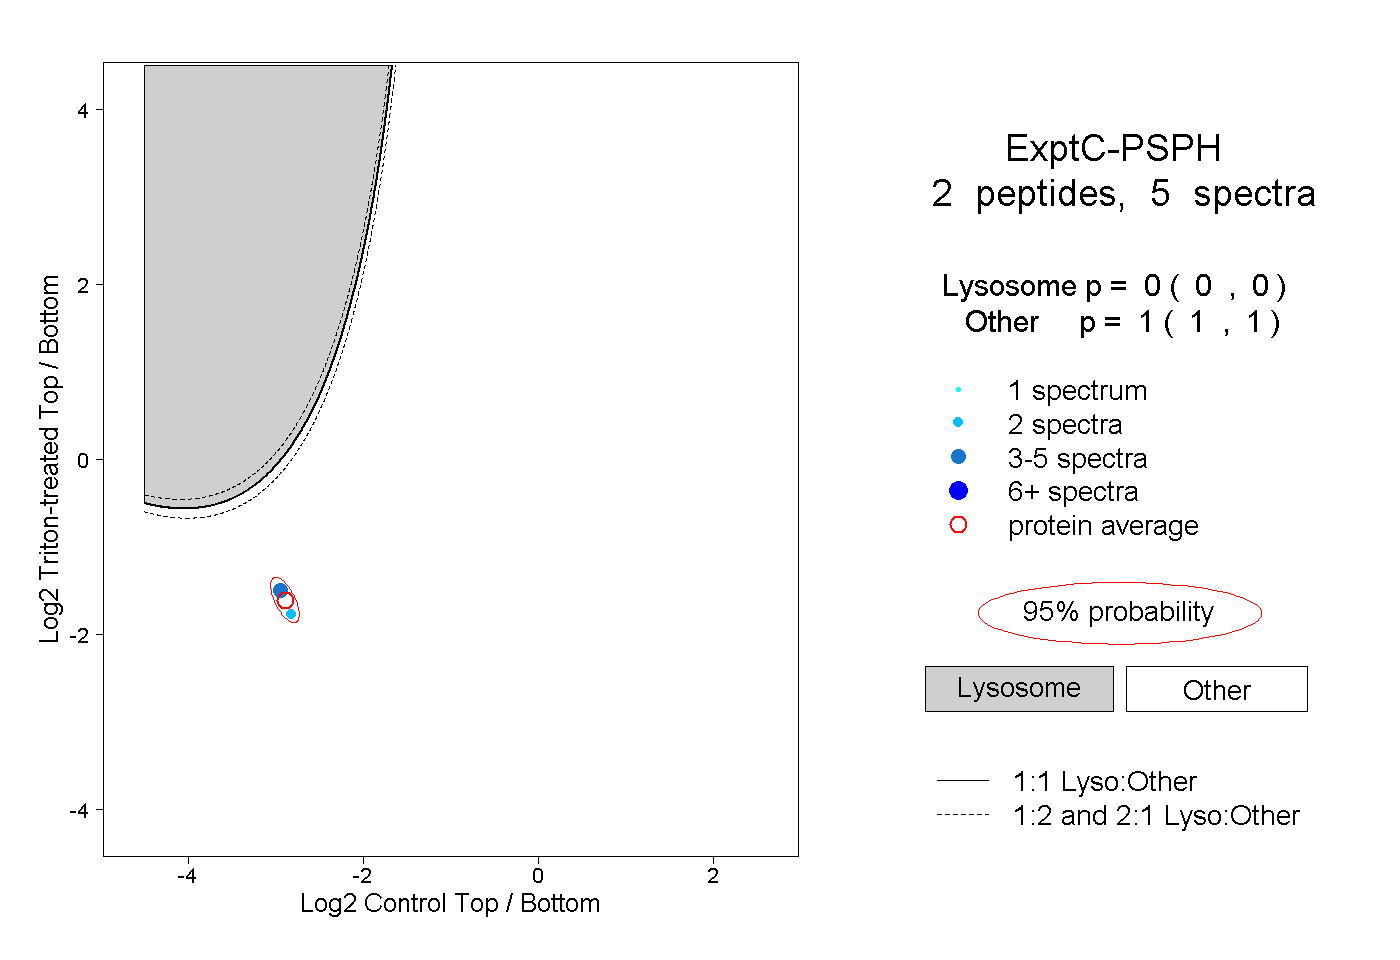
0.000 | 0.000
1.000 | 1.000