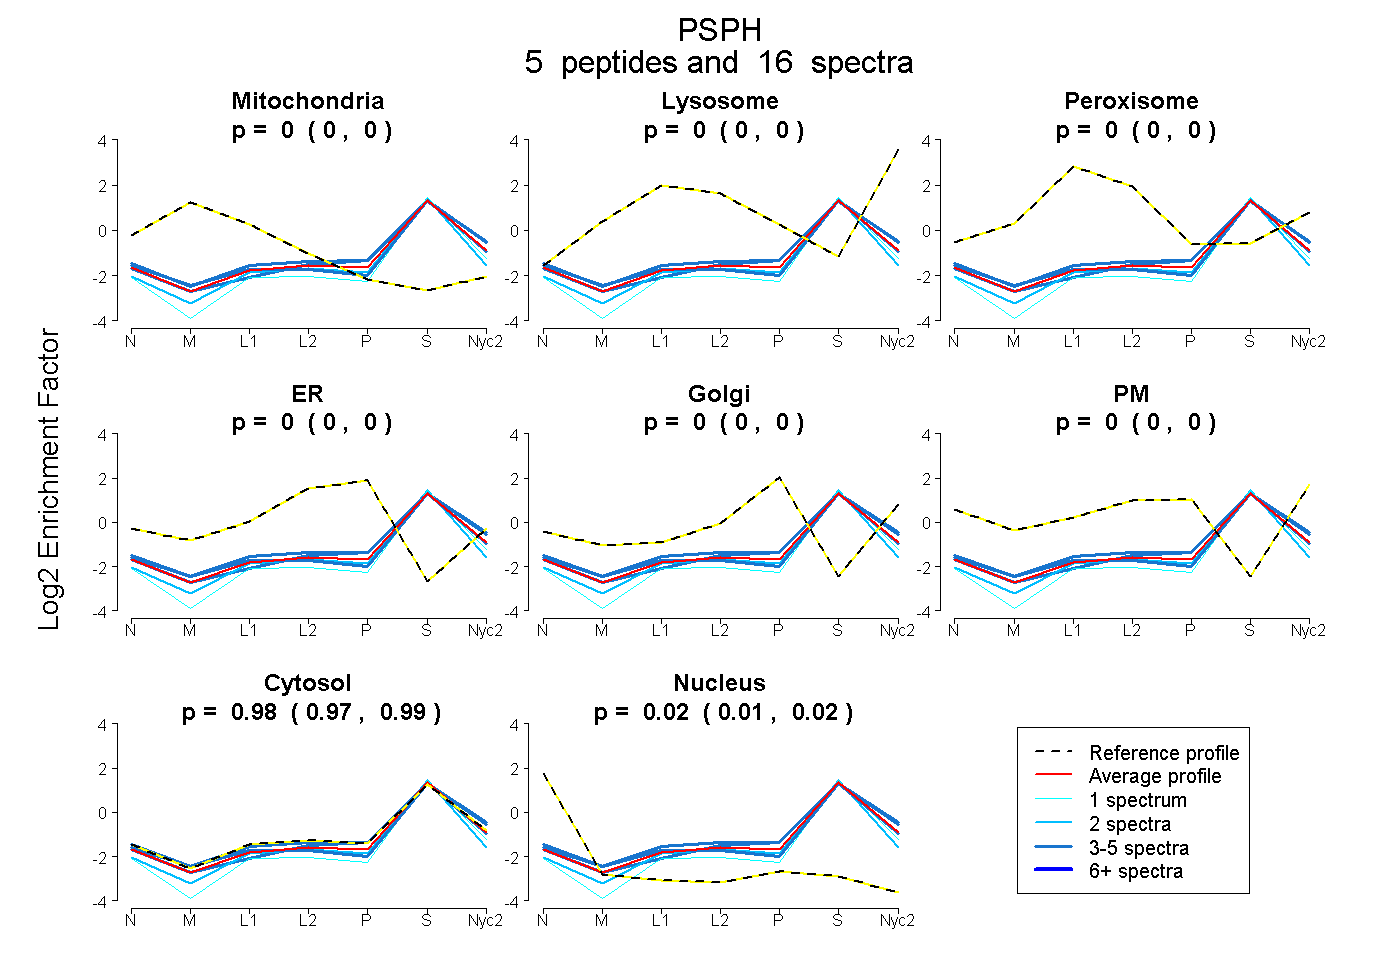
 5
5peptides
spectra
0.000 | 0.000
0.000 | 0.000
0.000 | 0.000
0.000 | 0.000
0.000 | 0.000
0.000 | 0.000
0.975 | 0.993
0.006 | 0.024
| Plot | Mito | Lyso | Perox | ER | Golgi | PM | Cytosol | Nucleus | |||||
| Expt A |
5 peptides |
16 spectra |
|
0.000 0.000 | 0.000 |
0.000 0.000 | 0.000 |
0.000 0.000 | 0.000 |
0.000 0.000 | 0.000 |
0.000 0.000 | 0.000 |
0.000 0.000 | 0.000 |
0.985 0.975 | 0.993 |
0.015 0.006 | 0.024 |
| 4 spectra, VIGFLK | 0.000 | 0.000 | 0.000 | 0.000 | 0.000 | 0.000 | 0.962 | 0.038 | ||
| 2 spectra, FCGVEAAVSEMTR | 0.000 | 0.000 | 0.000 | 0.000 | 0.000 | 0.000 | 0.962 | 0.038 | ||
| 1 spectrum, LNIPTTNVFANR | 0.000 | 0.000 | 0.000 | 0.000 | 0.000 | 0.000 | 0.952 | 0.048 | ||
| 4 spectra, EEGIDELAK | 0.000 | 0.000 | 0.000 | 0.000 | 0.000 | 0.000 | 1.000 | 0.000 | ||
| 5 spectra, LALIQPSR | 0.000 | 0.020 | 0.000 | 0.000 | 0.000 | 0.000 | 0.980 | 0.000 |
| Plot | Mito | Lyso or Perox | ER | Golgi | PM | Cytosol | Nucleus | ||||||
| Expt B |
1 peptide |
3 spectra |
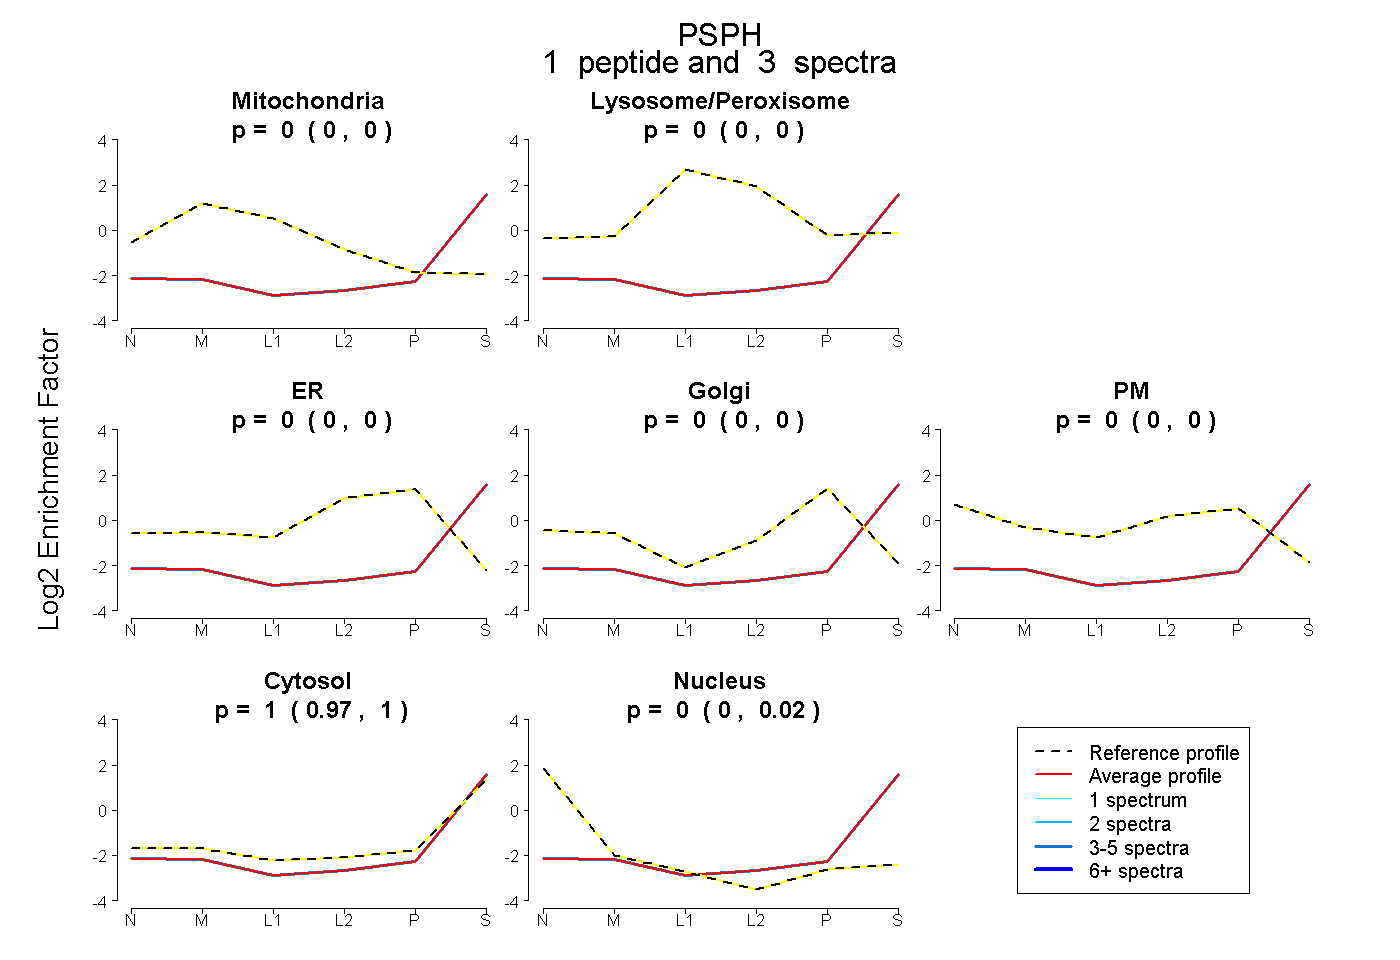 |
0.000 0.000 | 0.000 |
0.000 0.000 | 0.000 |
0.000 0.000 | 0.000 |
0.000 0.000 | 0.000 |
0.000 0.000 | 0.000 |
1.000 0.972 | 1.000 |
0.000 0.000 | 0.018 |
|||
| Plot | Lyso | Other | |||||||||||
| Expt C |
2 peptides |
5 spectra |
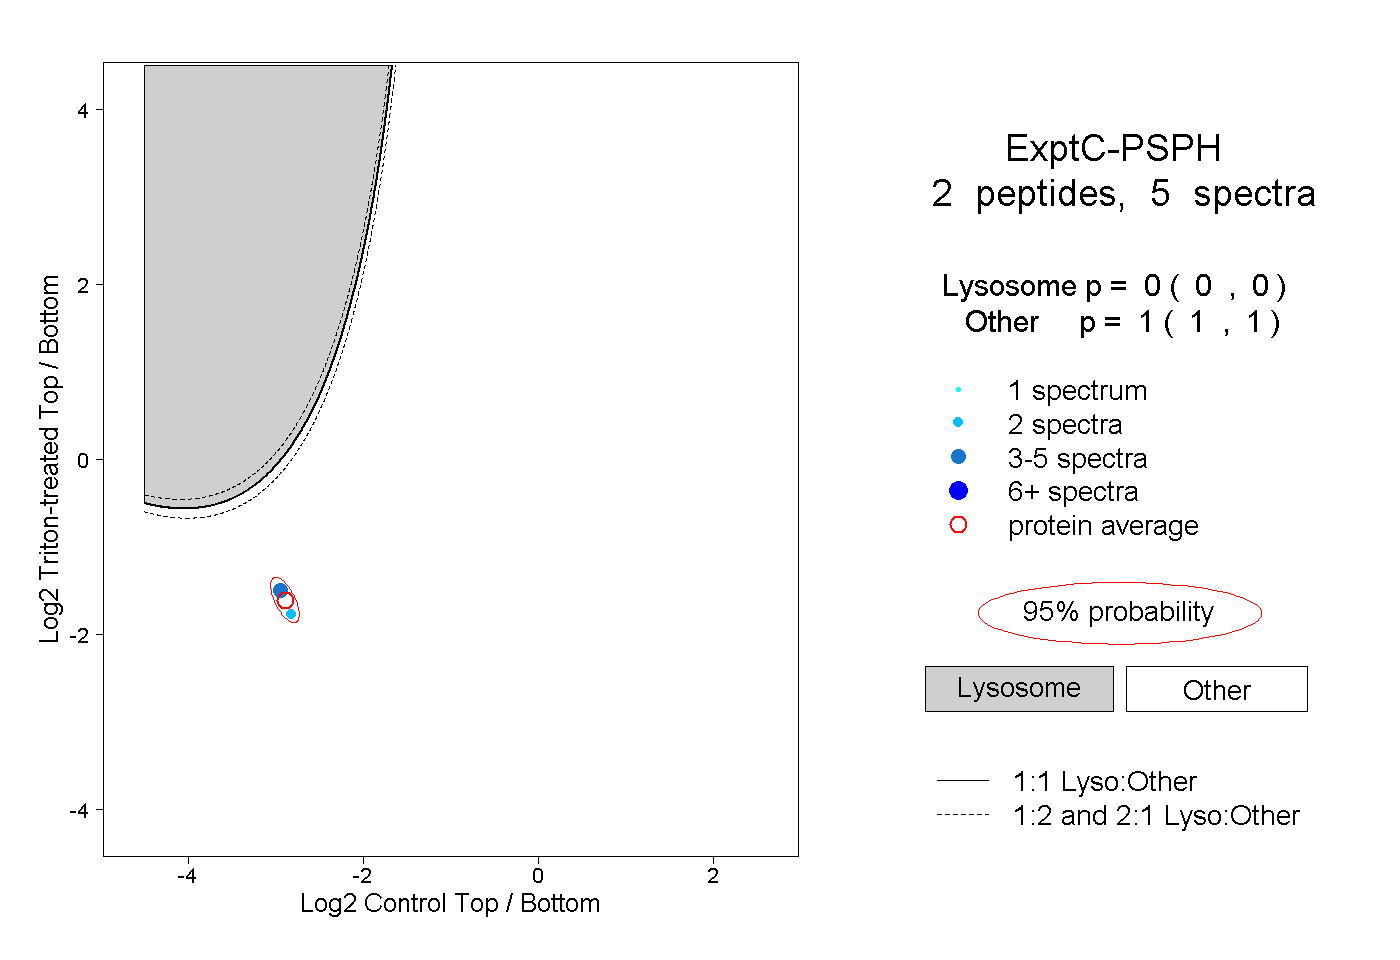 |
0.000 0.000 | 0.000 |
1.000 1.000 | 1.000 |