 17
17peptides
spectra
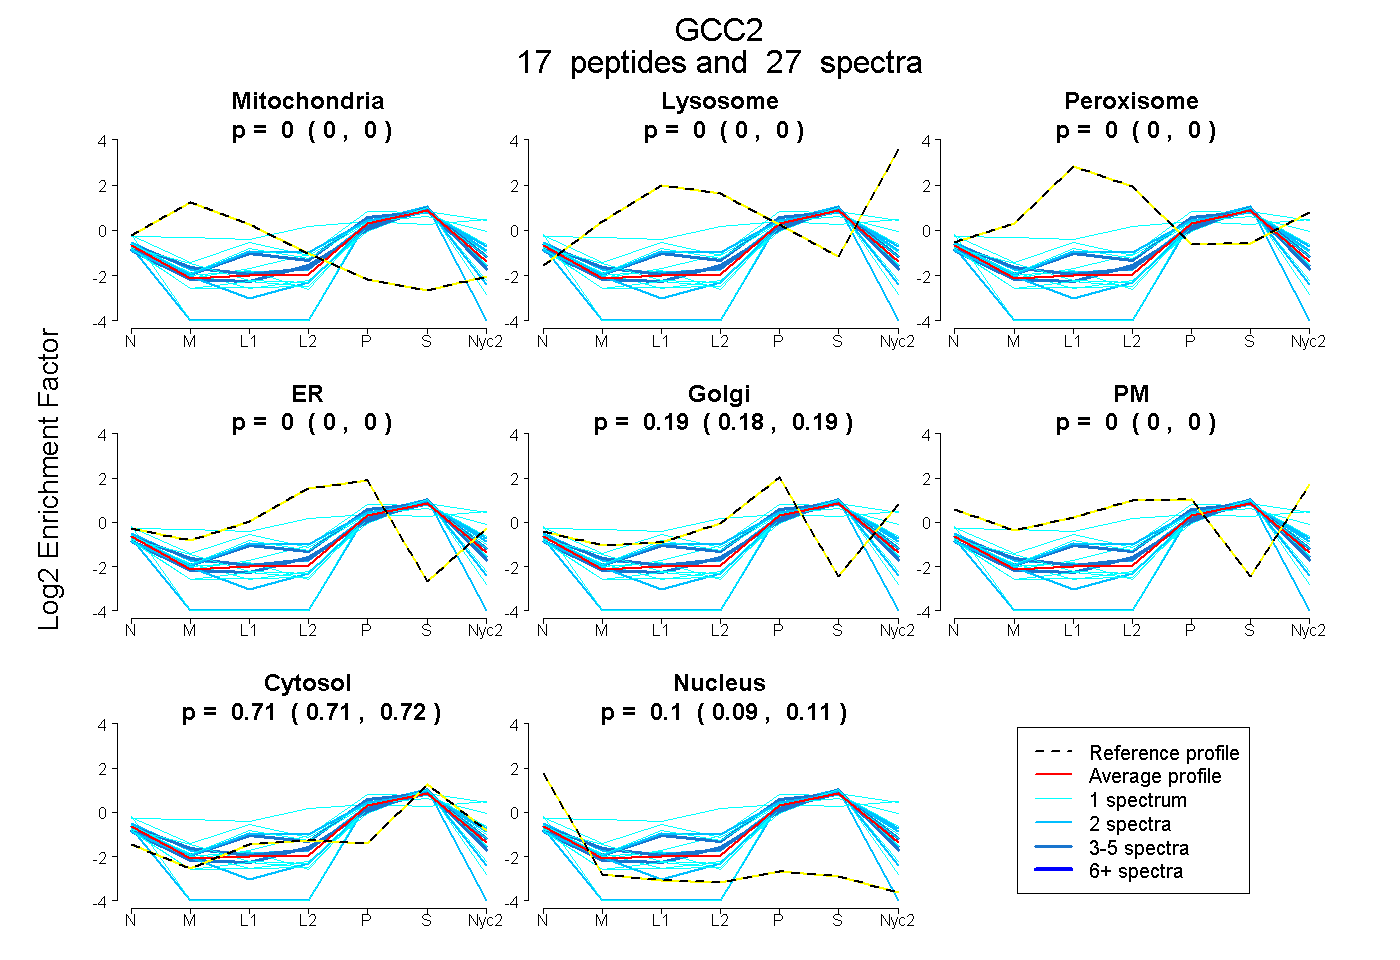
0.000 | 0.000
0.000 | 0.000
0.000 | 0.000
0.000 | 0.000
0.176 | 0.193
0.000 | 0.000
0.707 | 0.717
0.091 | 0.110
4peptides
spectra
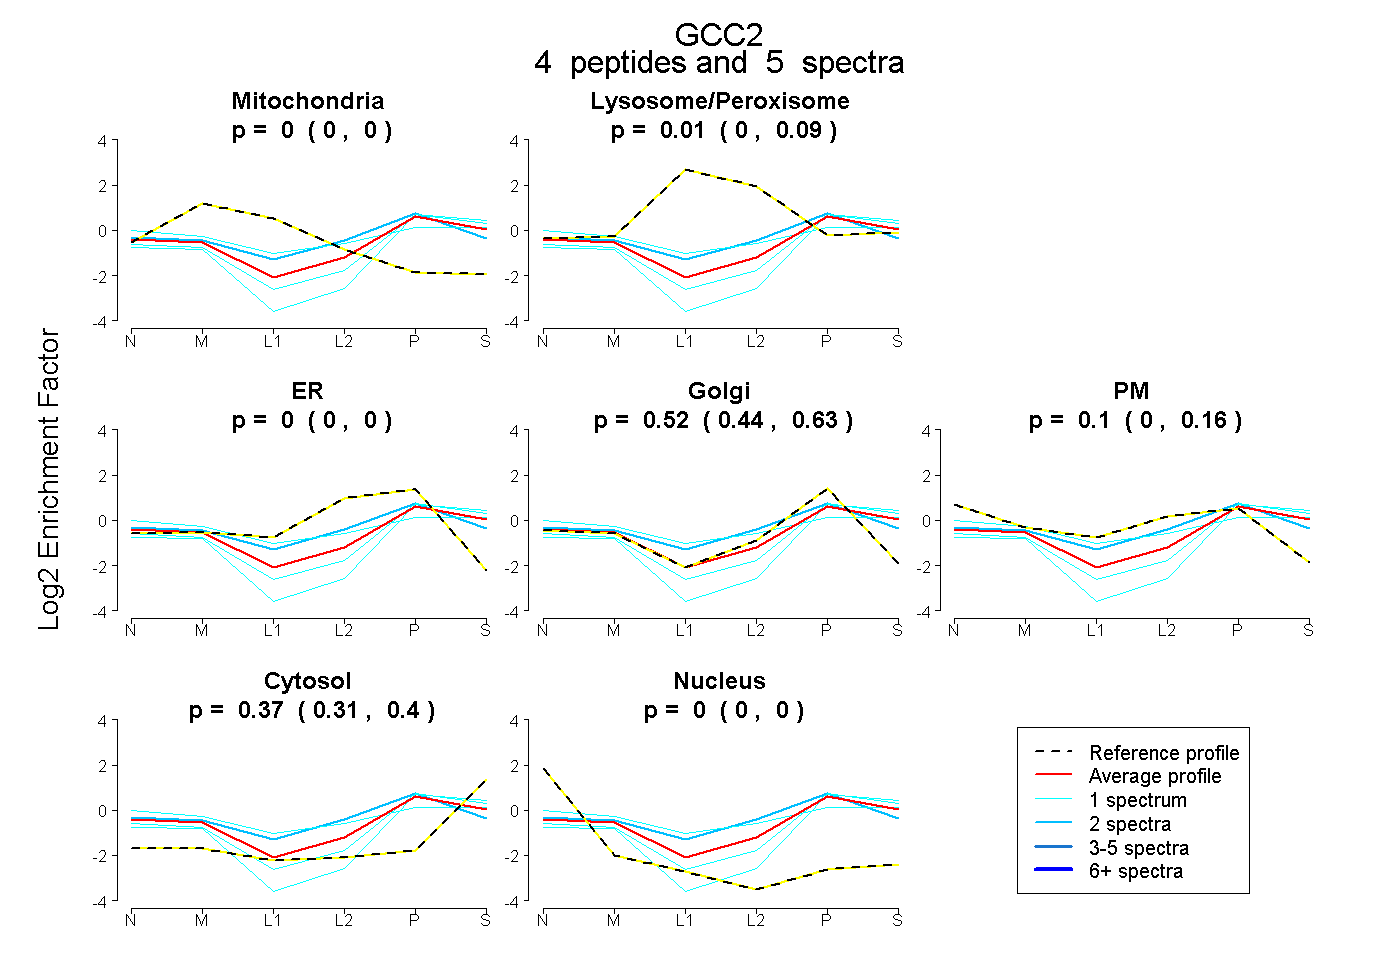
0.000 | 0.000
0.000 | 0.094
0.000 | 0.000
0.444 | 0.629
0.000 | 0.163
0.314 | 0.402
0.000 | 0.000
8peptides
spectra
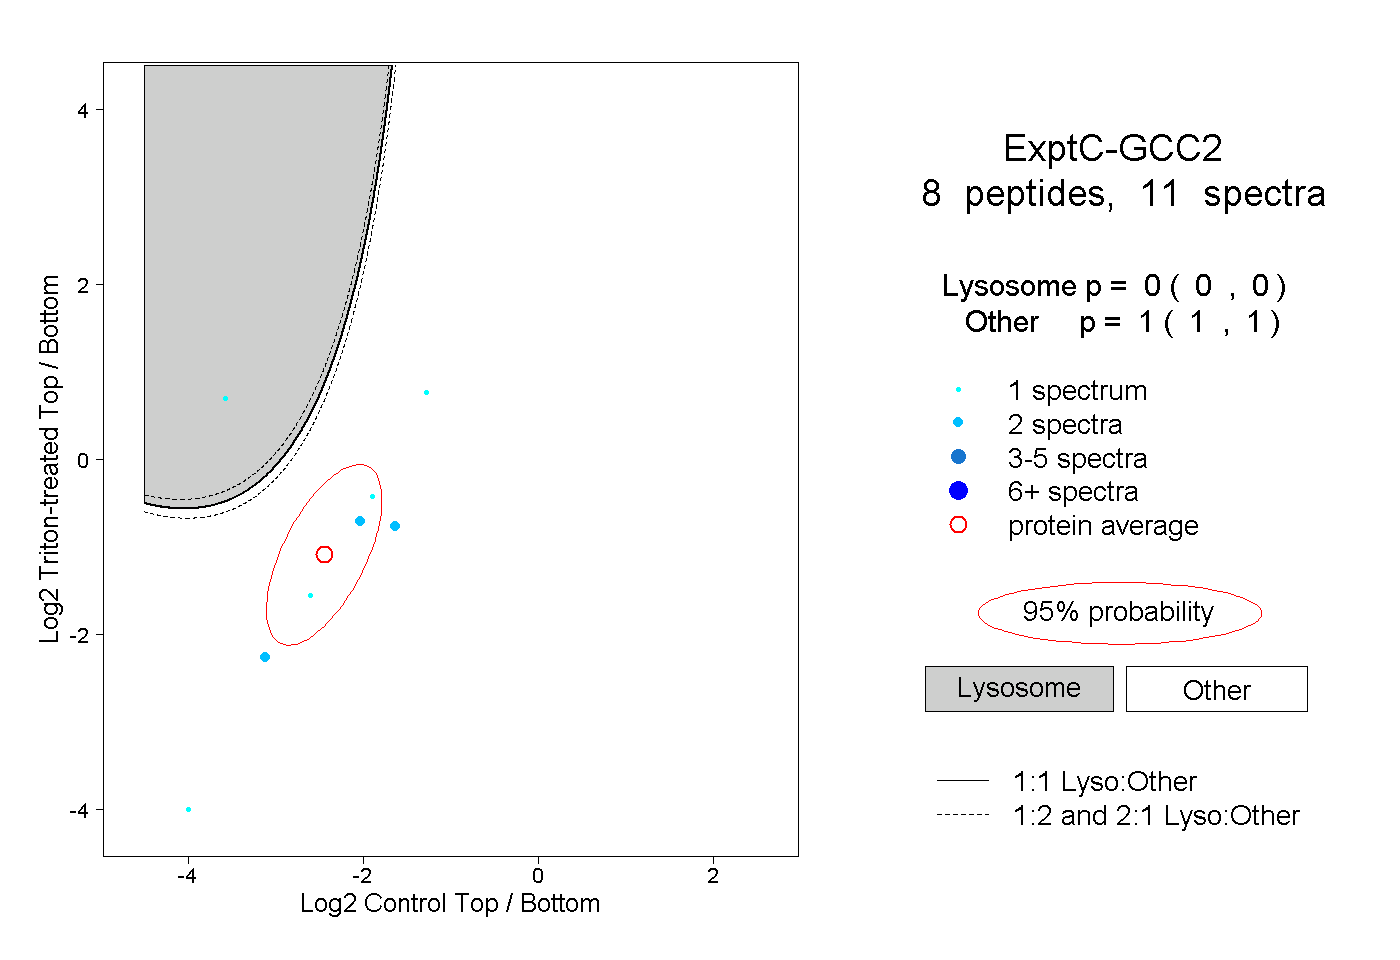
0.000 | 0.000
1.000 | 1.000
1peptide
spectrum
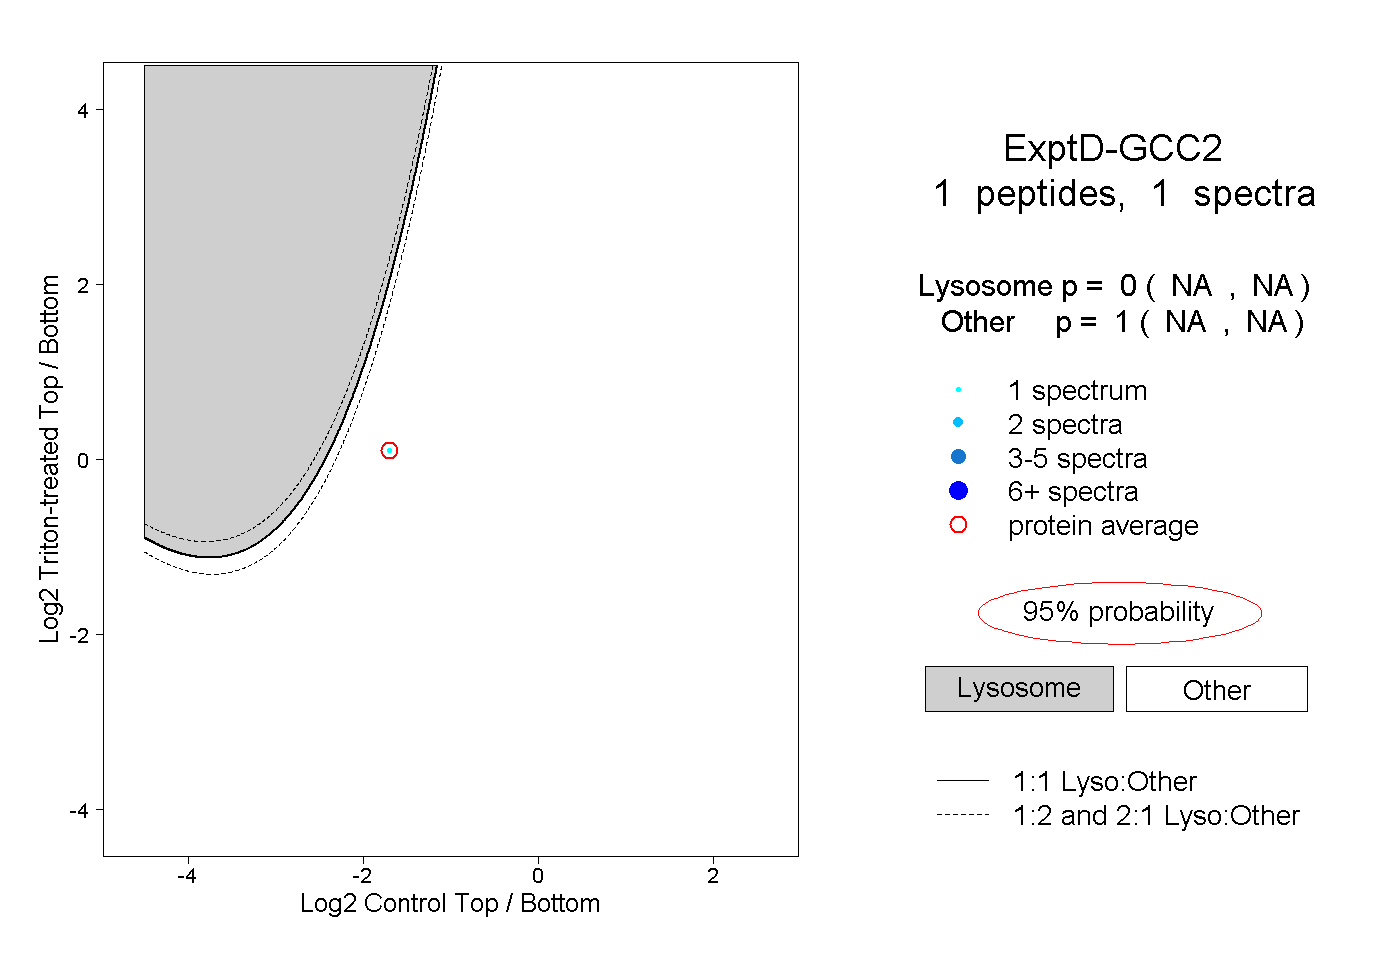
NA | NA
NA | NA