GCC2
[ENSRNOP00000001092]
Main page
| | | Plot |
Mito |
Lyso |
|
Perox |
ER |
Golgi |
PM |
Cytosol |
Nucleus |
|
| Expt A |
 17
17
peptides |
27
spectra |
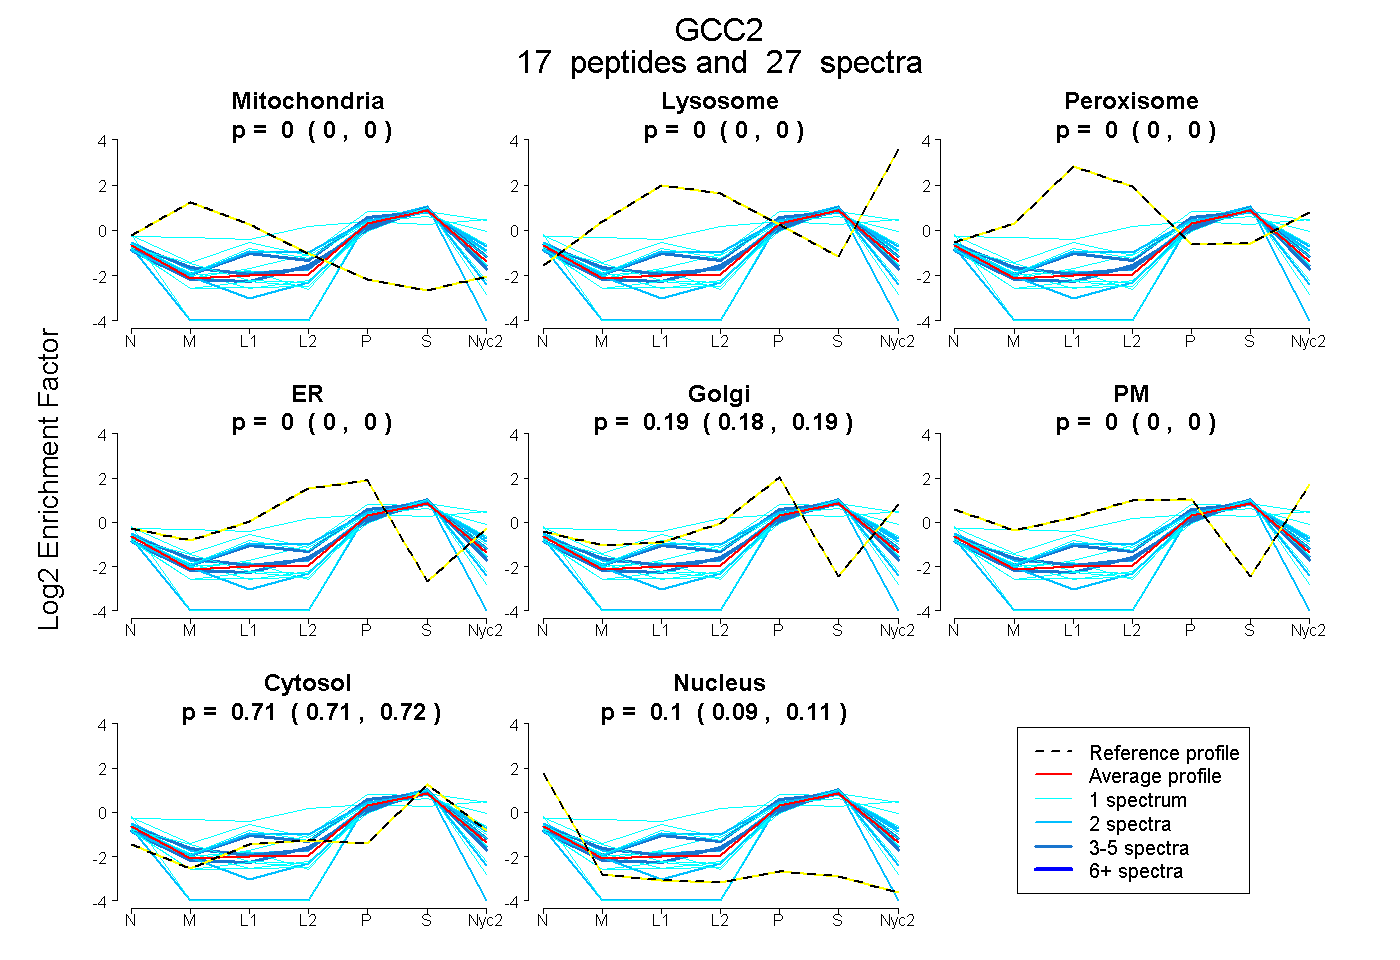 |
0.000
0.000 | 0.000 |
0.000
0.000 | 0.000 |
|
0.000
0.000 | 0.000 |
0.000
0.000 | 0.000 |
0.185
0.176 | 0.193 |
0.000
0.000 | 0.000 |
0.713
0.707 | 0.717 |
0.102
0.091 | 0.110 |
|
| | | Plot |
Mito |
|
Lyso or Perox |
|
ER |
Golgi |
PM |
Cytosol |
Nucleus |
|
| Expt B |
4
peptides |
5
spectra |
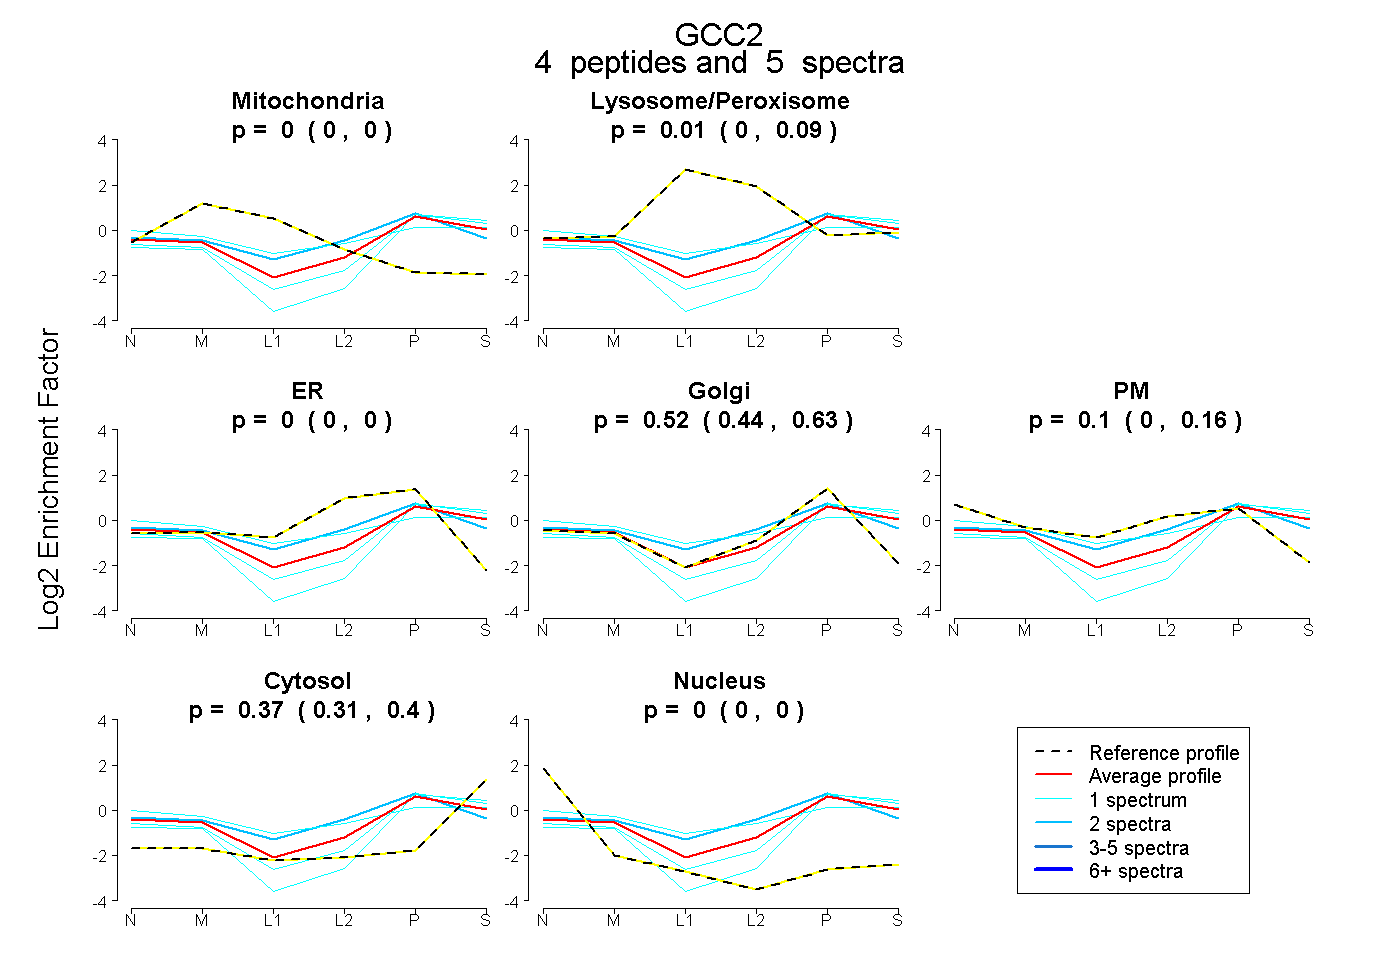 |
0.000
0.000 | 0.000 |
|
0.009
0.000 | 0.094 |
|
0.000
0.000 | 0.000 |
0.525
0.444 | 0.629 |
0.100
0.000 | 0.163 |
0.366
0.314 | 0.402 |
0.000
0.000 | 0.000 |
|
| 2 spectra, DLEGAVHR |
0.000 |
|
0.188 |
|
0.000 |
0.535 |
0.077 |
0.200 |
0.000 |
|
| 1 spectrum, QAELLEQLK |
0.000 |
|
0.133 |
|
0.000 |
0.087 |
0.437 |
0.343 |
0.000 |
|
| 1 spectrum, ESELQDVR |
0.000 |
|
0.000 |
|
0.000 |
0.565 |
0.000 |
0.435 |
0.000 |
|
| 1 spectrum, LDALLLEK |
0.000 |
|
0.000 |
|
0.000 |
0.488 |
0.000 |
0.509 |
0.003 |
|
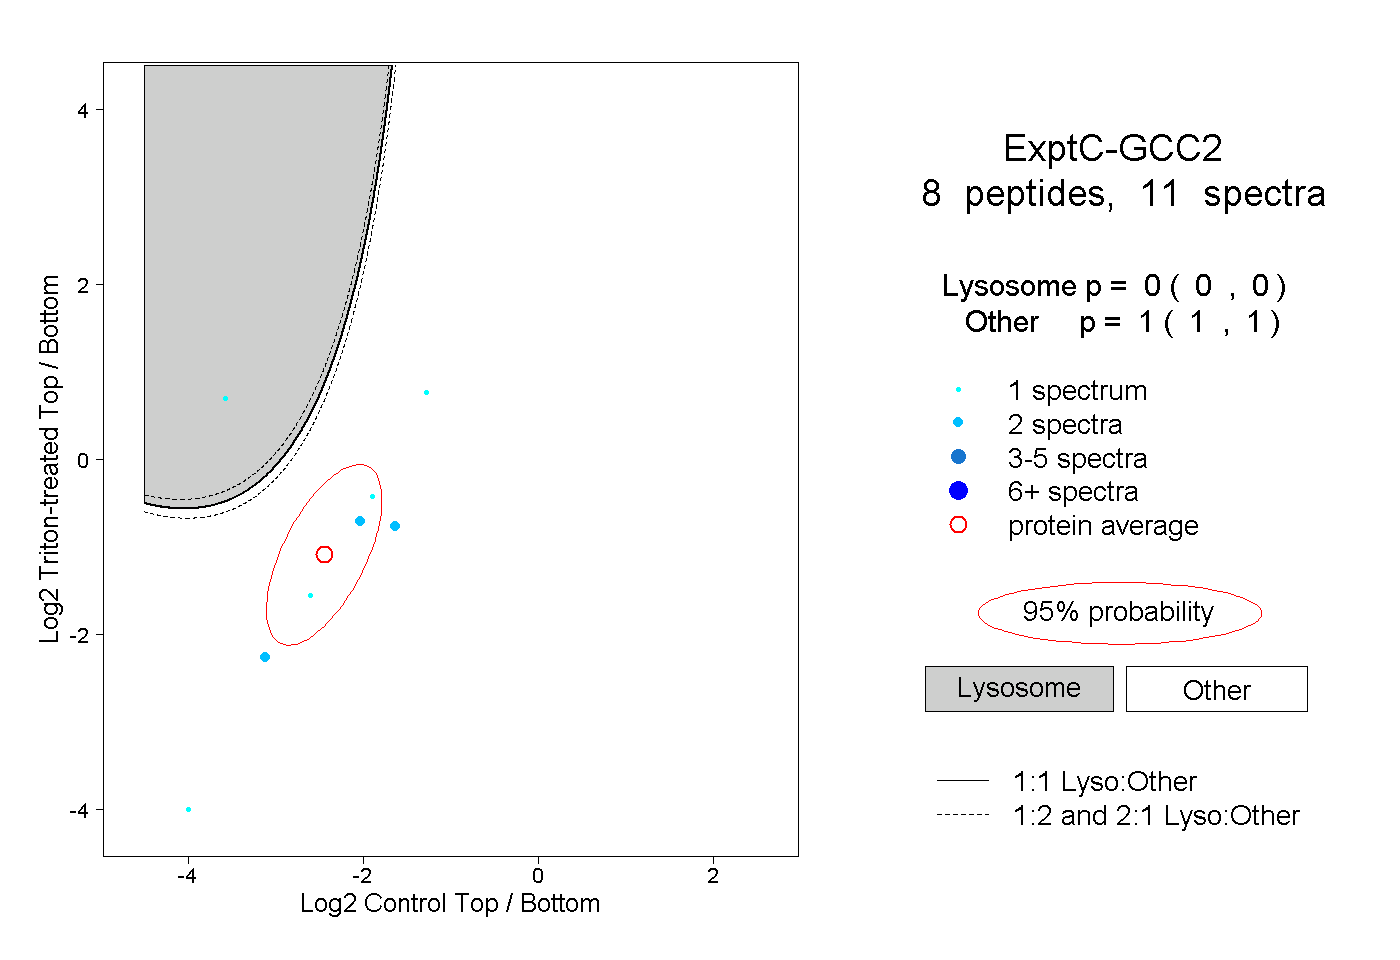
| | | Plot |
|
Lyso |
|
|
|
|
|
|
|
Other |
| Expt C |
8
peptides |
11
spectra |
 |
|
0.000
0.000 | 0.000 |
|
|
|
|
|
|
|
1.000
1.000 | 1.000 |
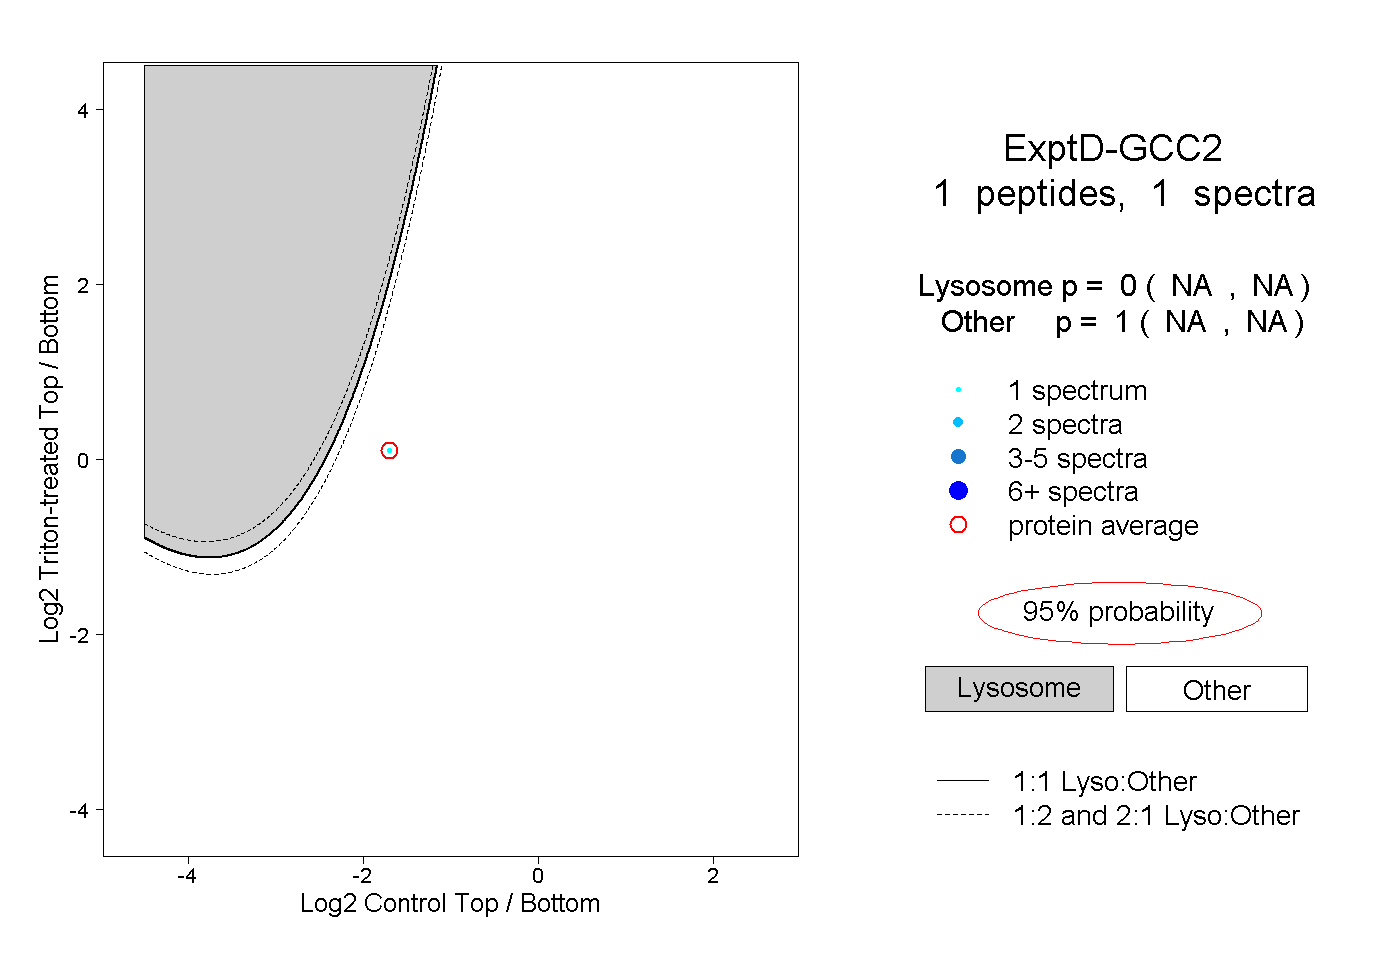
| | | Plot |
|
Lyso |
|
|
|
|
|
|
|
Other |
| Expt D |
1
peptide |
1
spectrum |
 |
|
0.000
NA | NA |
|
|
|
|
|
|
|
1.000
NA | NA |