 6
6peptides
spectra
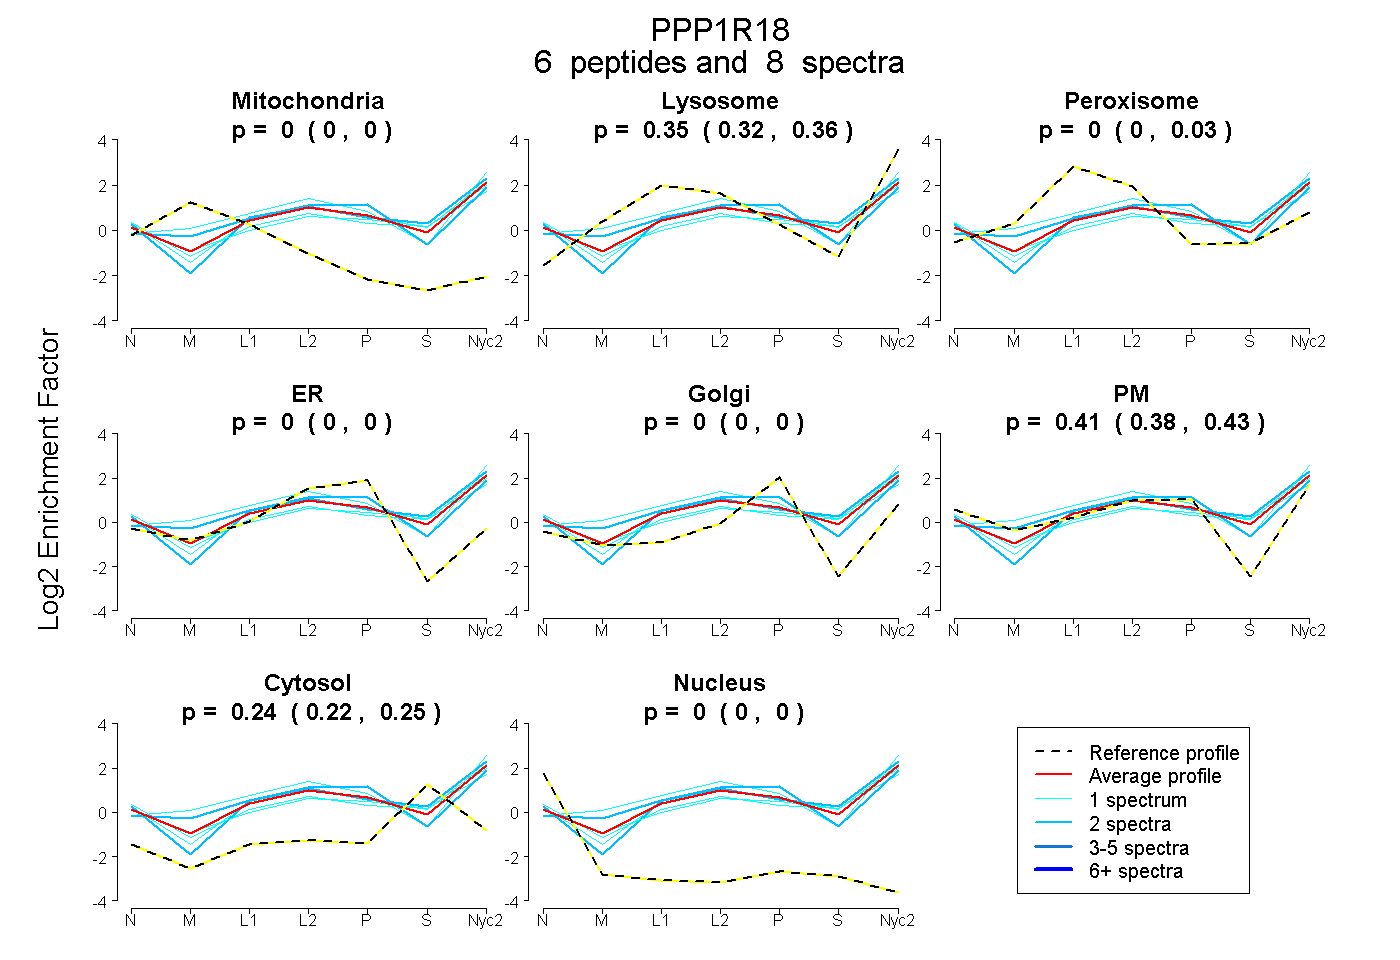
0.000 | 0.000
0.316 | 0.362
0.000 | 0.028
0.000 | 0.000
0.000 | 0.000
0.383 | 0.432
0.222 | 0.255
0.000 | 0.000
9peptides
spectra
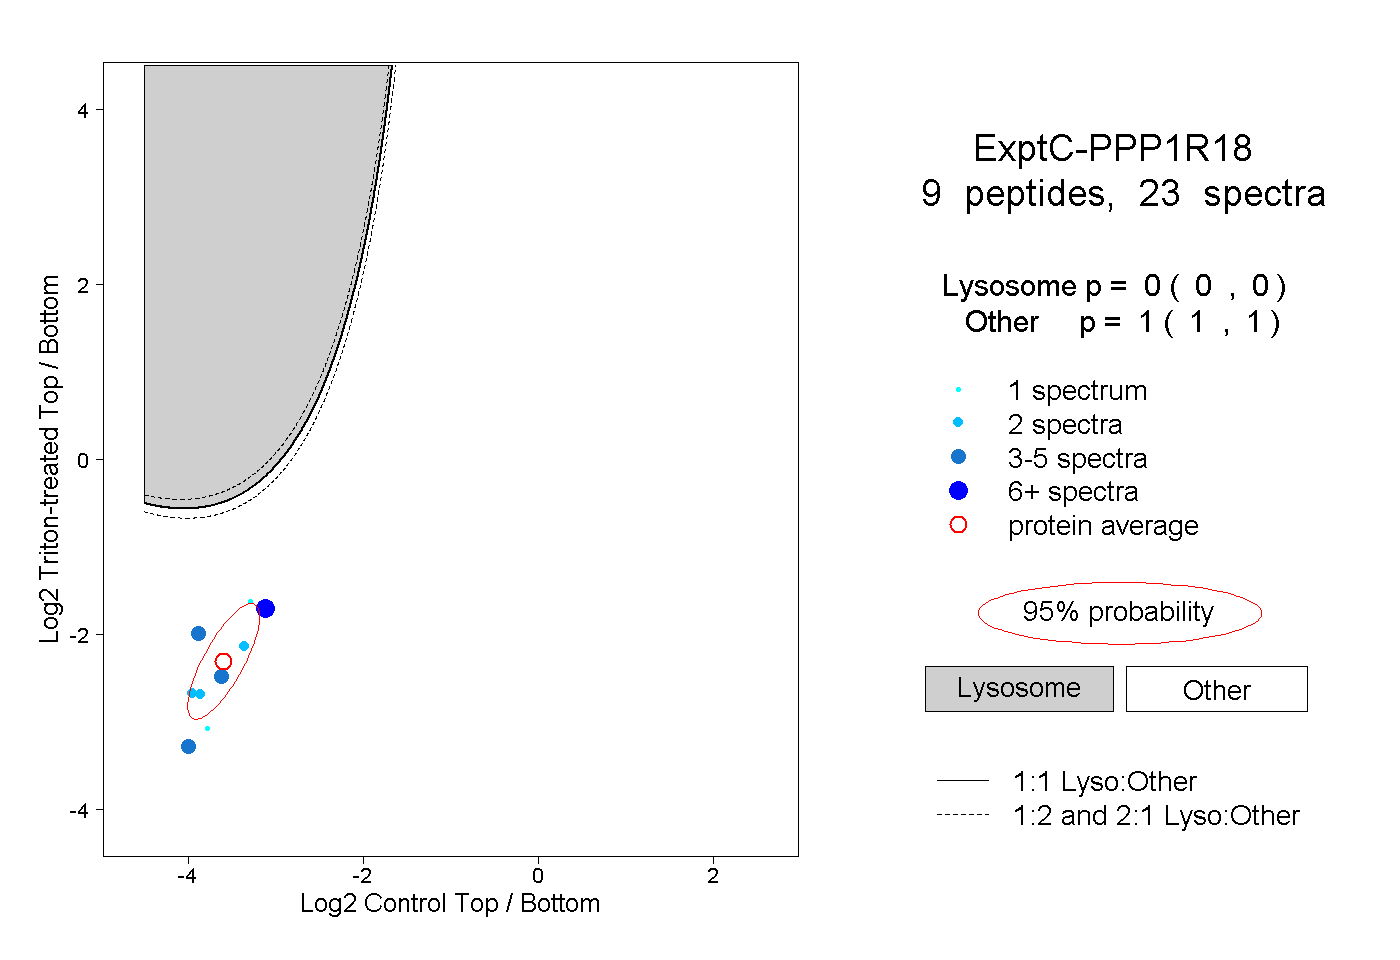
0.000 | 0.000
1.000 | 1.000
1peptide
spectrum
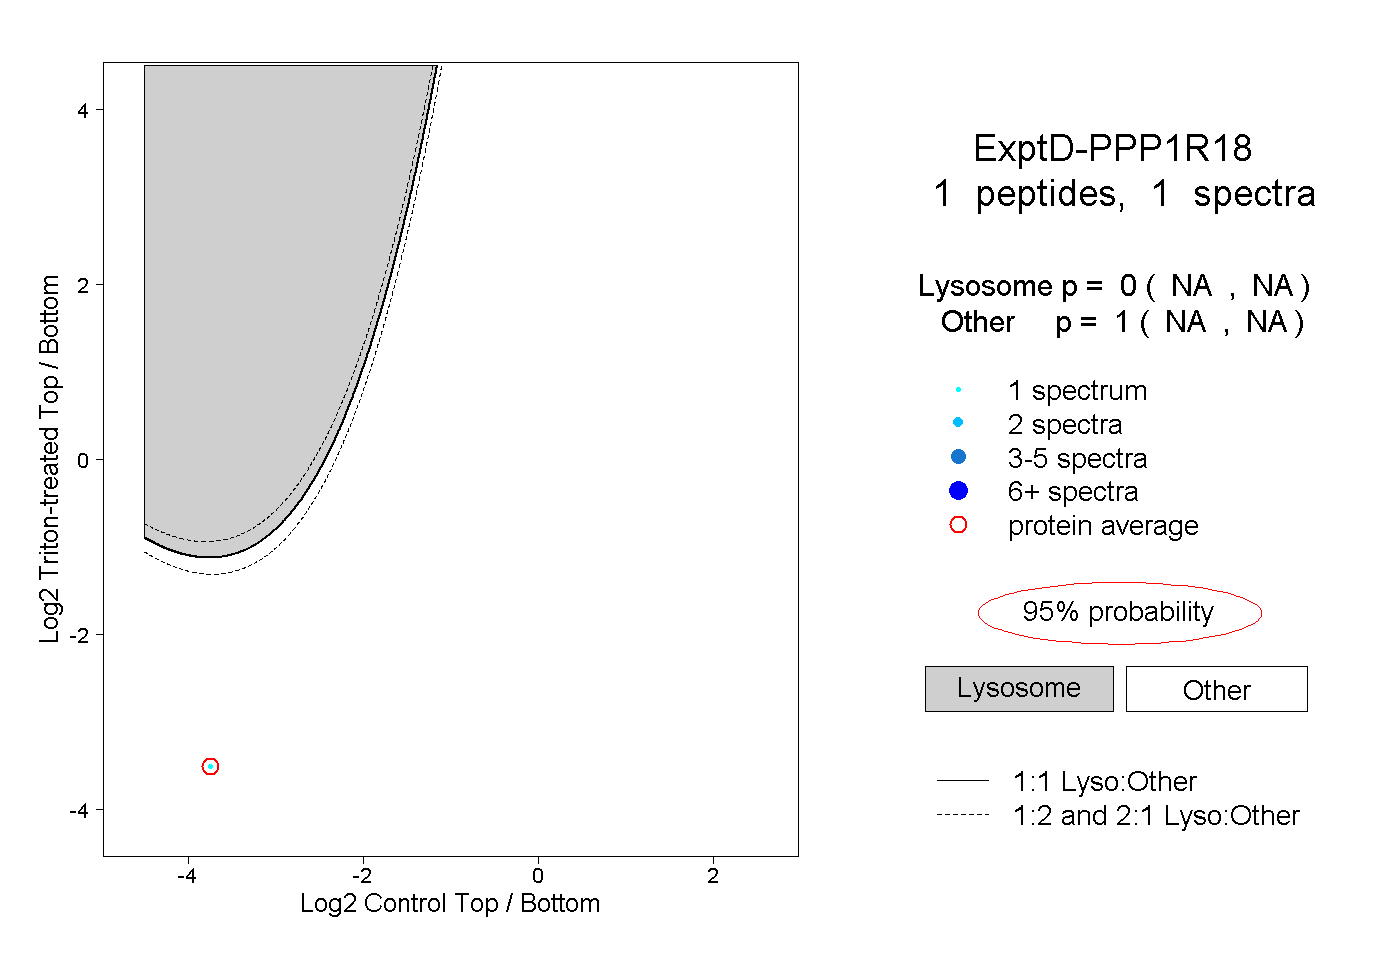
NA | NA
NA | NA