 6
6peptides
spectra
0.000 | 0.000
0.316 | 0.362
0.000 | 0.028
0.000 | 0.000
0.000 | 0.000
0.383 | 0.432
0.222 | 0.255
0.000 | 0.000
| Plot | Mito | Lyso | Perox | ER | Golgi | PM | Cytosol | Nucleus | |||||
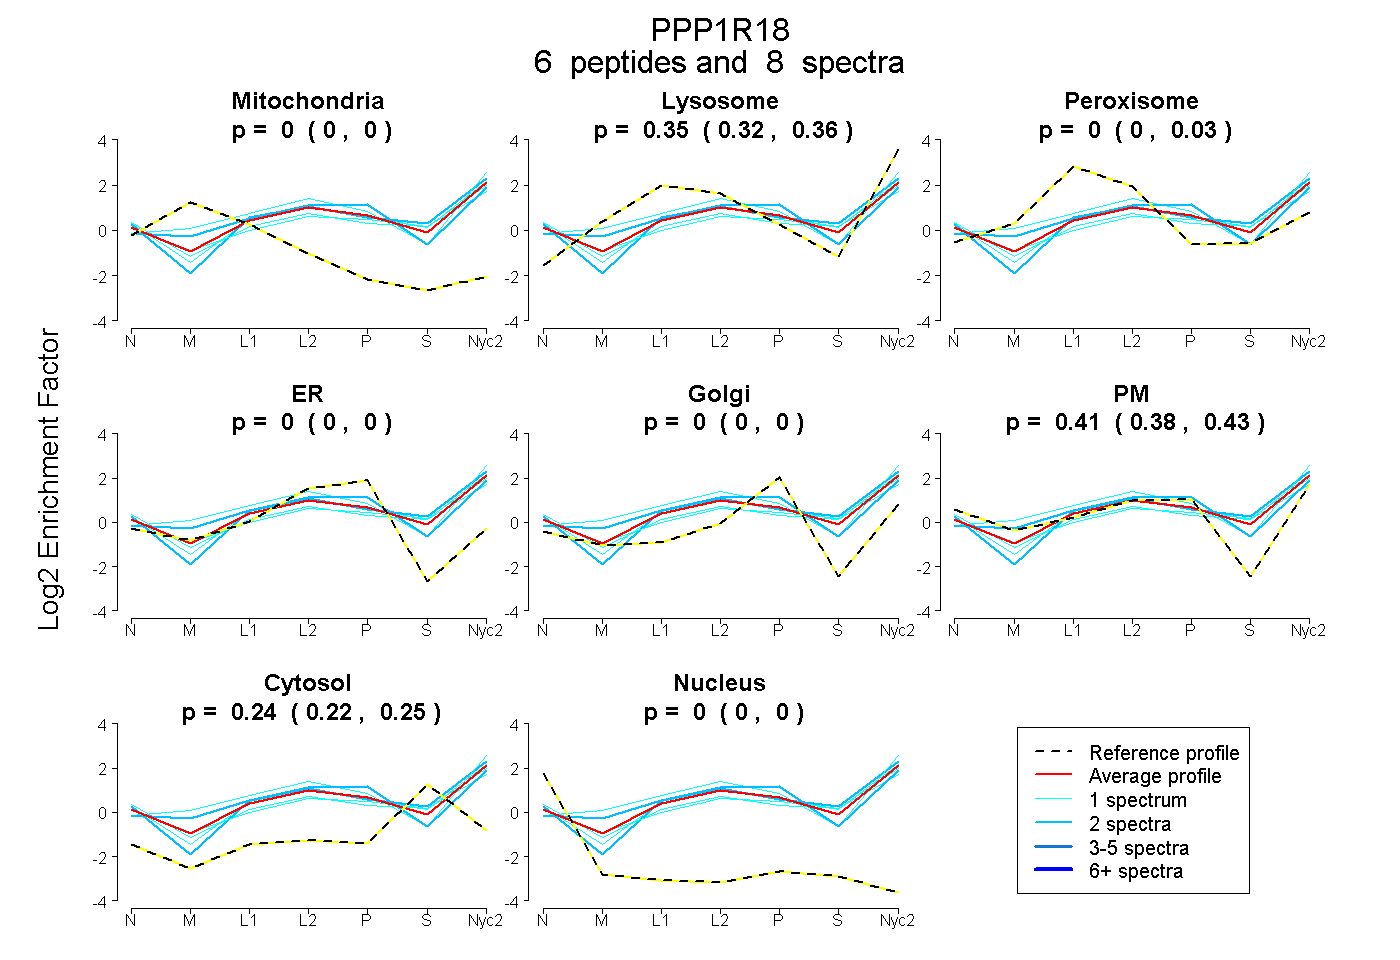
| Expt A |
6 peptides |
8 spectra |
|
0.000 0.000 | 0.000 |
0.346 0.316 | 0.362 |
0.002 0.000 | 0.028 |
0.000 0.000 | 0.000 |
0.000 0.000 | 0.000 |
0.410 0.383 | 0.432 |
0.242 0.222 | 0.255 |
0.000 0.000 | 0.000 |
| 1 spectrum, LQLLAR | 0.000 | 0.493 | 0.018 | 0.000 | 0.000 | 0.408 | 0.081 | 0.000 | ||
| 1 spectrum, DLDSRPAEAQK | 0.000 | 0.336 | 0.000 | 0.000 | 0.000 | 0.391 | 0.273 | 0.000 | ||
| 1 spectrum, LSPGESGDQK | 0.000 | 0.297 | 0.000 | 0.000 | 0.000 | 0.383 | 0.320 | 0.000 | ||
| 2 spectra, EVQDTTSR | 0.000 | 0.359 | 0.000 | 0.000 | 0.000 | 0.339 | 0.303 | 0.000 | ||
| 2 spectra, SSPGNLR | 0.000 | 0.312 | 0.076 | 0.000 | 0.113 | 0.381 | 0.118 | 0.000 | ||
| 1 spectrum, EVETAEQRPTEGWK | 0.000 | 0.211 | 0.053 | 0.000 | 0.000 | 0.415 | 0.322 | 0.000 |
| Plot | Lyso | Other | |||||||||||
| Expt C |
9 peptides |
23 spectra |
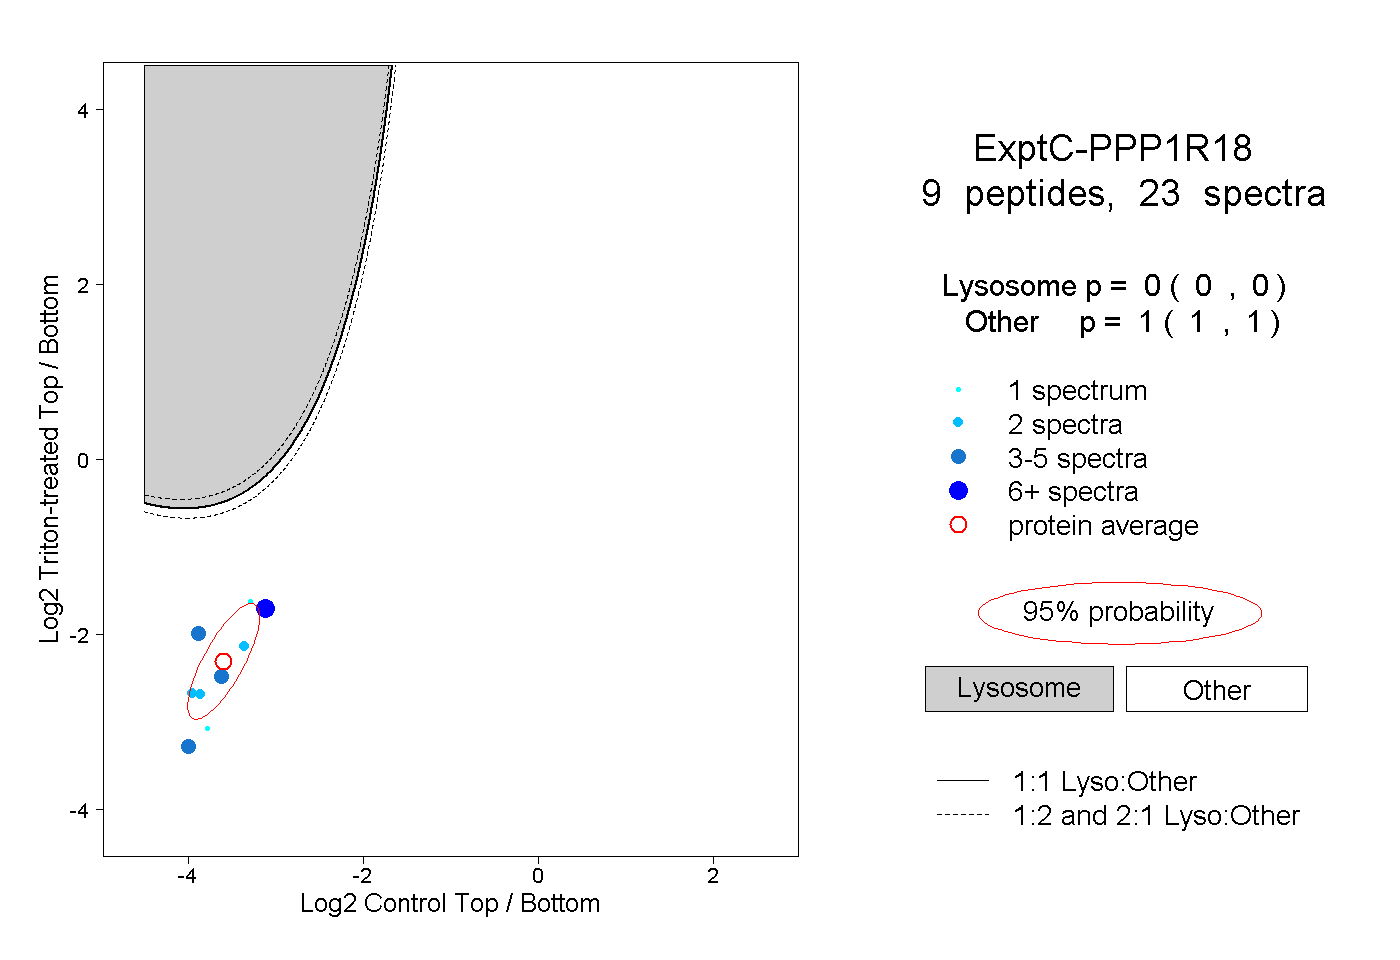 |
0.000 0.000 | 0.000 |
1.000 1.000 | 1.000 |
||||||||
| Plot | Lyso | Other | |||||||||||
| Expt D |
1 peptide |
1 spectrum |
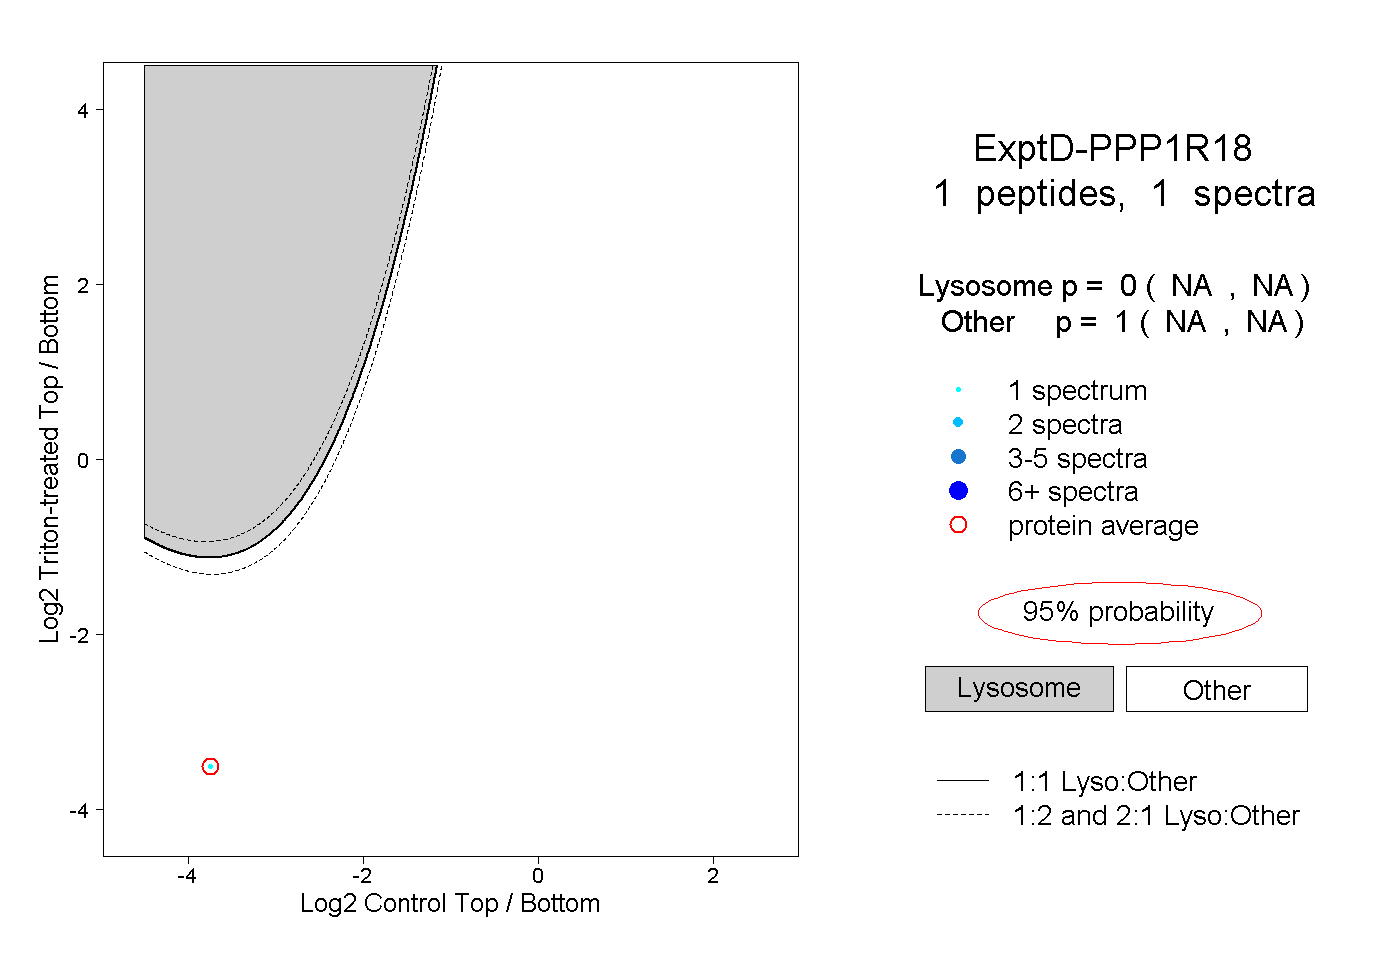 |
0.000 NA | NA |
1.000 NA | NA |