 9
9peptides
spectra
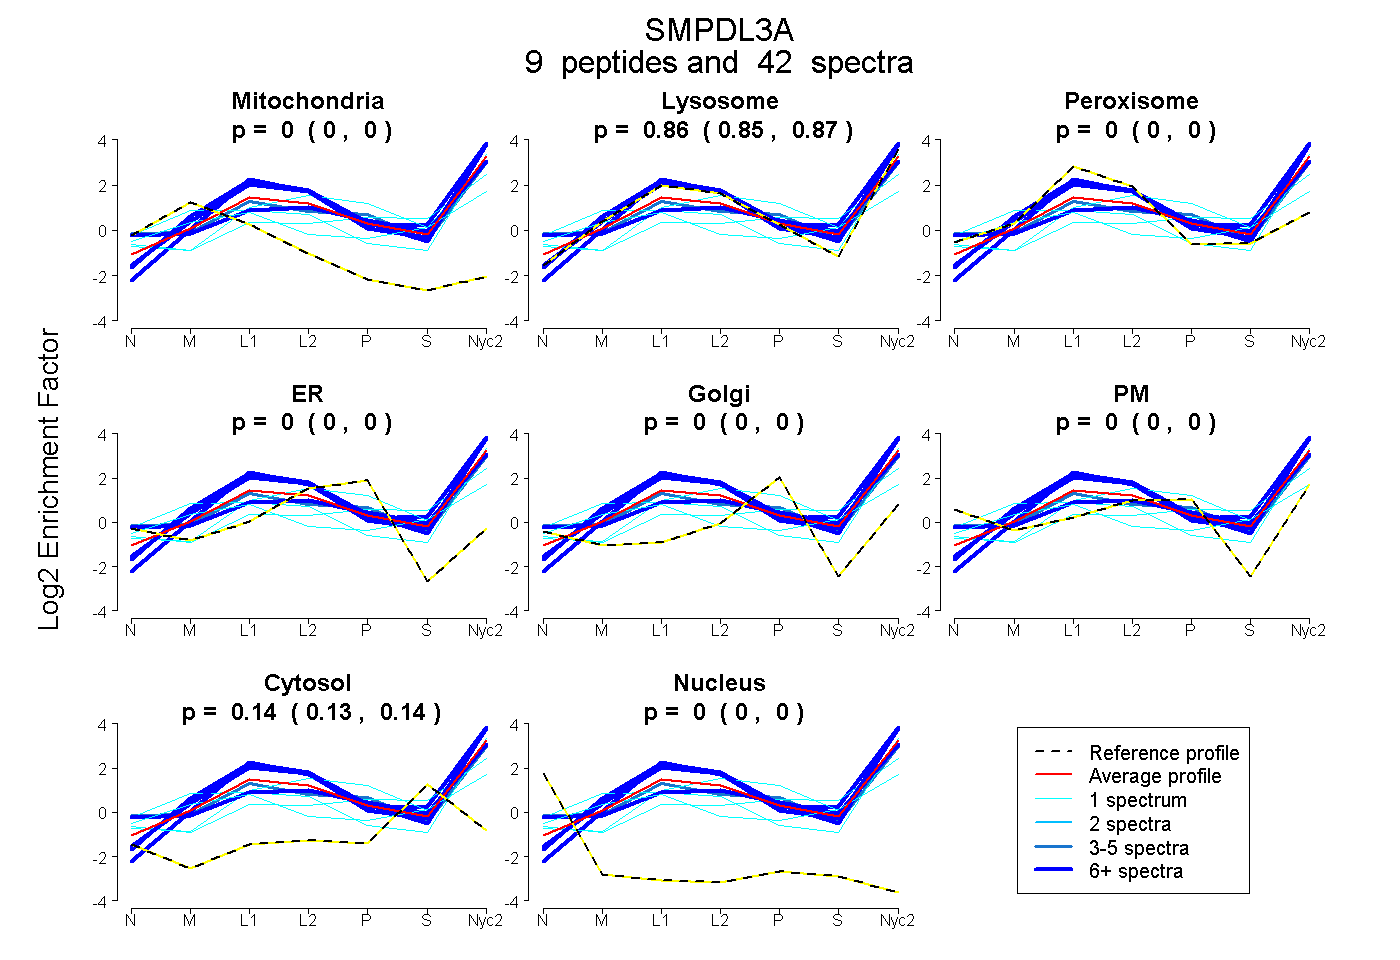
0.000 | 0.000
0.855 | 0.871
0.000 | 0.000
0.000 | 0.000
0.000 | 0.000
0.000 | 0.004
0.127 | 0.142
0.000 | 0.000
8peptides
spectra
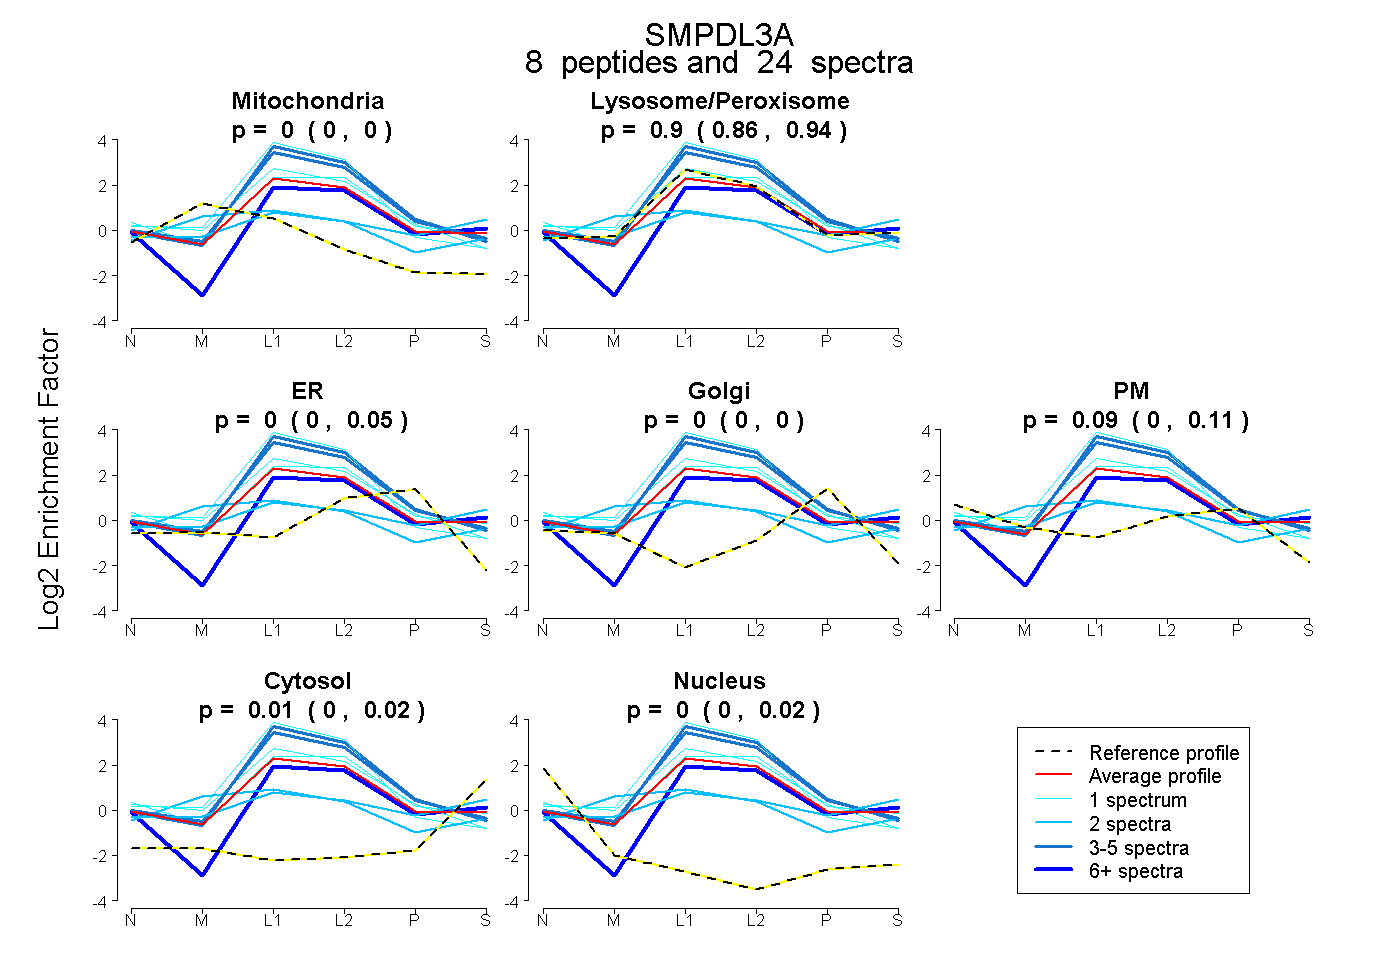
0.000 | 0.000
0.860 | 0.942
0.000 | 0.049
0.000 | 0.000
0.000 | 0.109
0.000 | 0.021
0.000 | 0.024
13peptides
spectra
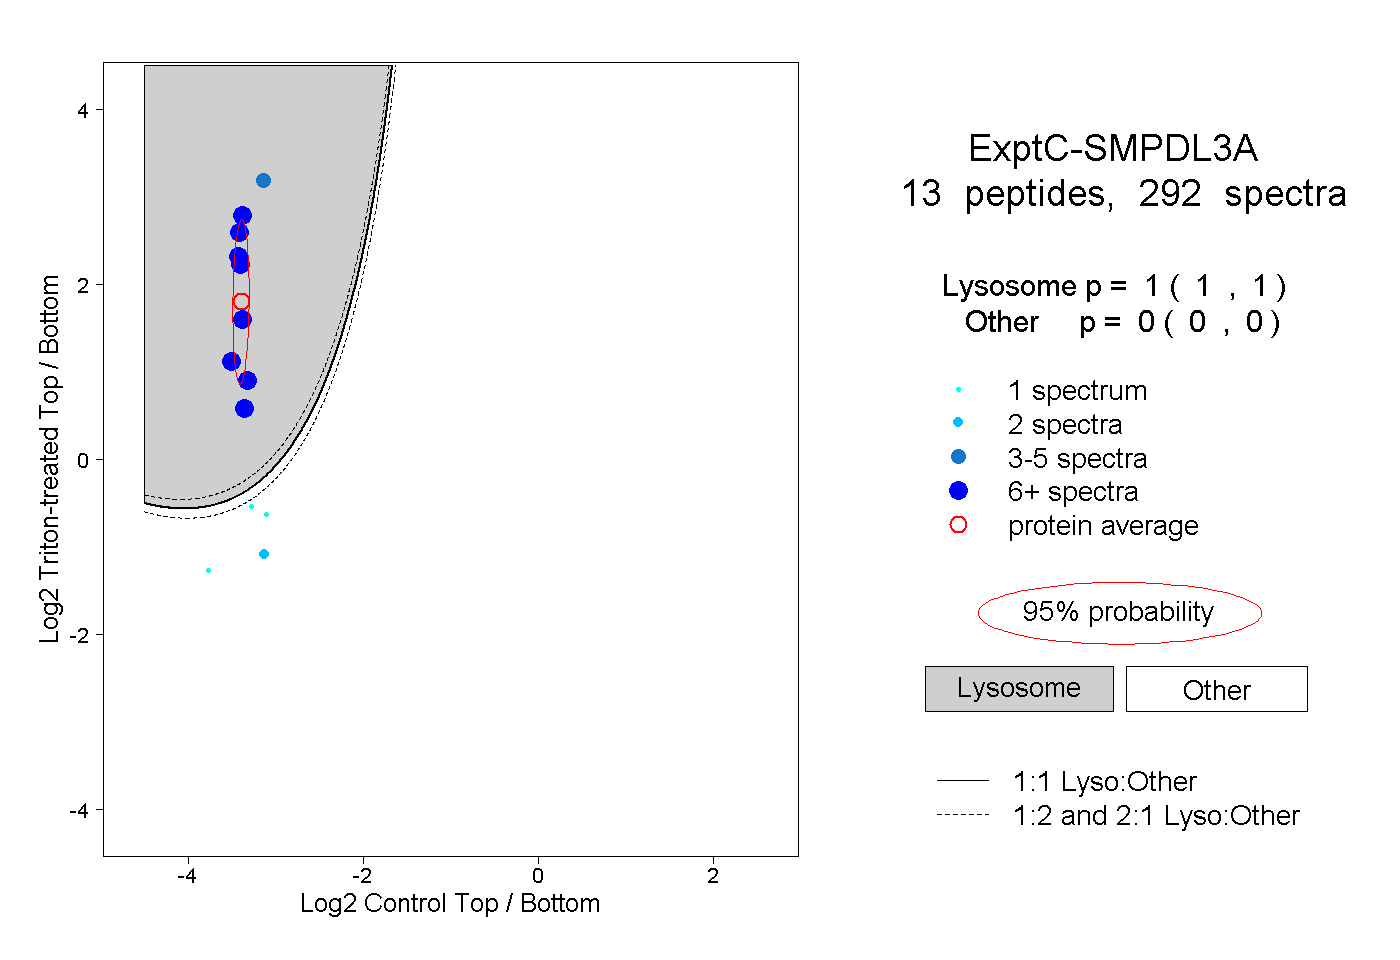
1.000 | 1.000
0.000 | 0.000
4peptides
spectra
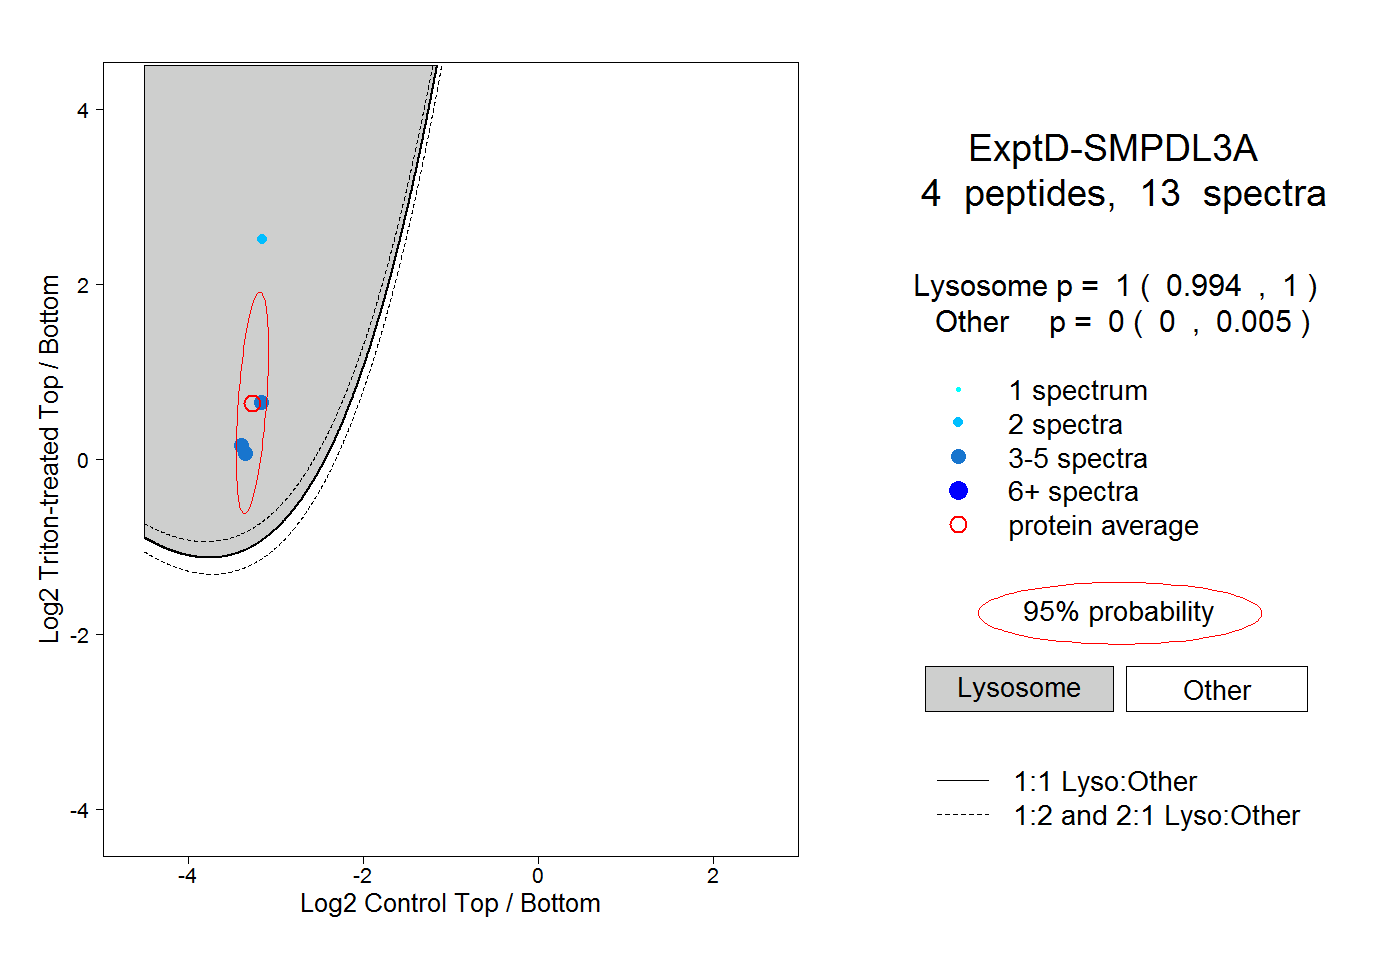
0.994 | 1.000
0.000 | 0.005