 9
9peptides
spectra
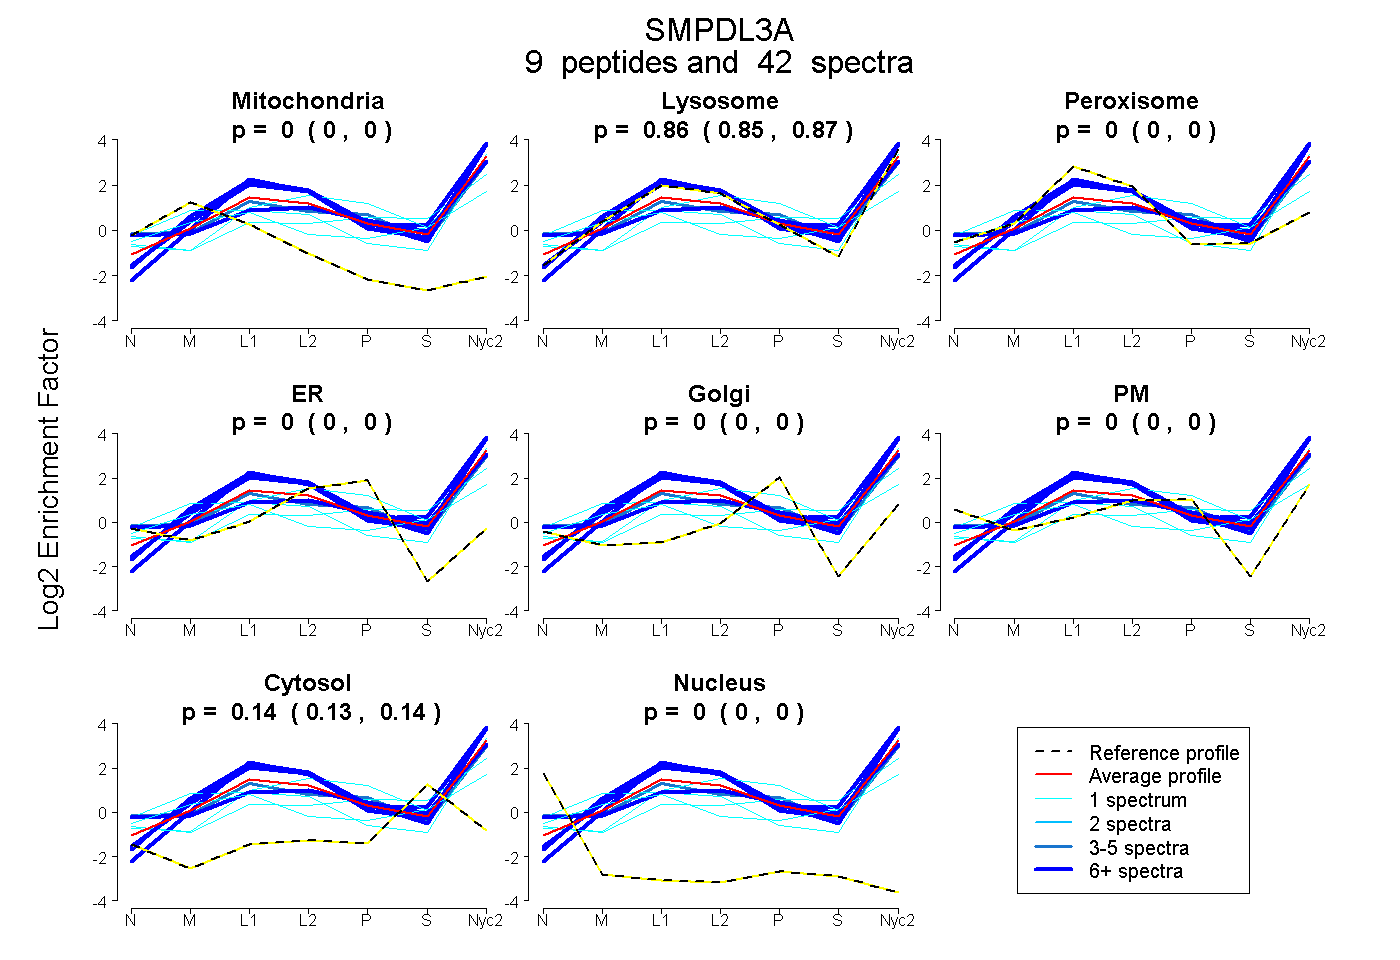
0.000 | 0.000
0.855 | 0.871
0.000 | 0.000
0.000 | 0.000
0.000 | 0.000
0.000 | 0.004
0.127 | 0.142
0.000 | 0.000
| Plot | Mito | Lyso | Perox | ER | Golgi | PM | Cytosol | Nucleus | |||||
| Expt A |
9 peptides |
42 spectra |
|
0.000 0.000 | 0.000 |
0.865 0.855 | 0.871 |
0.000 0.000 | 0.000 |
0.000 0.000 | 0.000 |
0.000 0.000 | 0.000 |
0.000 0.000 | 0.004 |
0.135 0.127 | 0.142 |
0.000 0.000 | 0.000 |
| 7 spectra, YSSVIAGQFYGHTHR | 0.000 | 0.640 | 0.000 | 0.000 | 0.000 | 0.200 | 0.160 | 0.000 | ||
| 1 spectrum, NSGQEASFMIWTGDSPPHVPVR | 0.032 | 0.852 | 0.000 | 0.000 | 0.000 | 0.015 | 0.000 | 0.101 | ||
| 1 spectrum, YYHYFFVSYDSSAPCDQR | 0.127 | 0.522 | 0.044 | 0.000 | 0.000 | 0.019 | 0.289 | 0.000 | ||
| 1 spectrum, SLHGLAQQLATIDSK | 0.000 | 0.704 | 0.000 | 0.000 | 0.099 | 0.057 | 0.139 | 0.000 | ||
| 1 spectrum, QYYNEK | 0.000 | 0.539 | 0.000 | 0.000 | 0.055 | 0.062 | 0.343 | 0.000 | ||
| 4 spectra, DSLMVLSDK | 0.000 | 0.613 | 0.000 | 0.000 | 0.000 | 0.286 | 0.101 | 0.000 | ||
| 11 spectra, ETNNPGVR | 0.000 | 1.000 | 0.000 | 0.000 | 0.000 | 0.000 | 0.000 | 0.000 | ||
| 10 spectra, VASNPDLR | 0.000 | 0.985 | 0.000 | 0.000 | 0.000 | 0.000 | 0.015 | 0.000 | ||
| 6 spectra, GGFYSQK | 0.000 | 0.963 | 0.000 | 0.000 | 0.000 | 0.000 | 0.037 | 0.000 |
| Plot | Mito | Lyso or Perox | ER | Golgi | PM | Cytosol | Nucleus | ||||||
| Expt B |
8 peptides |
24 spectra |
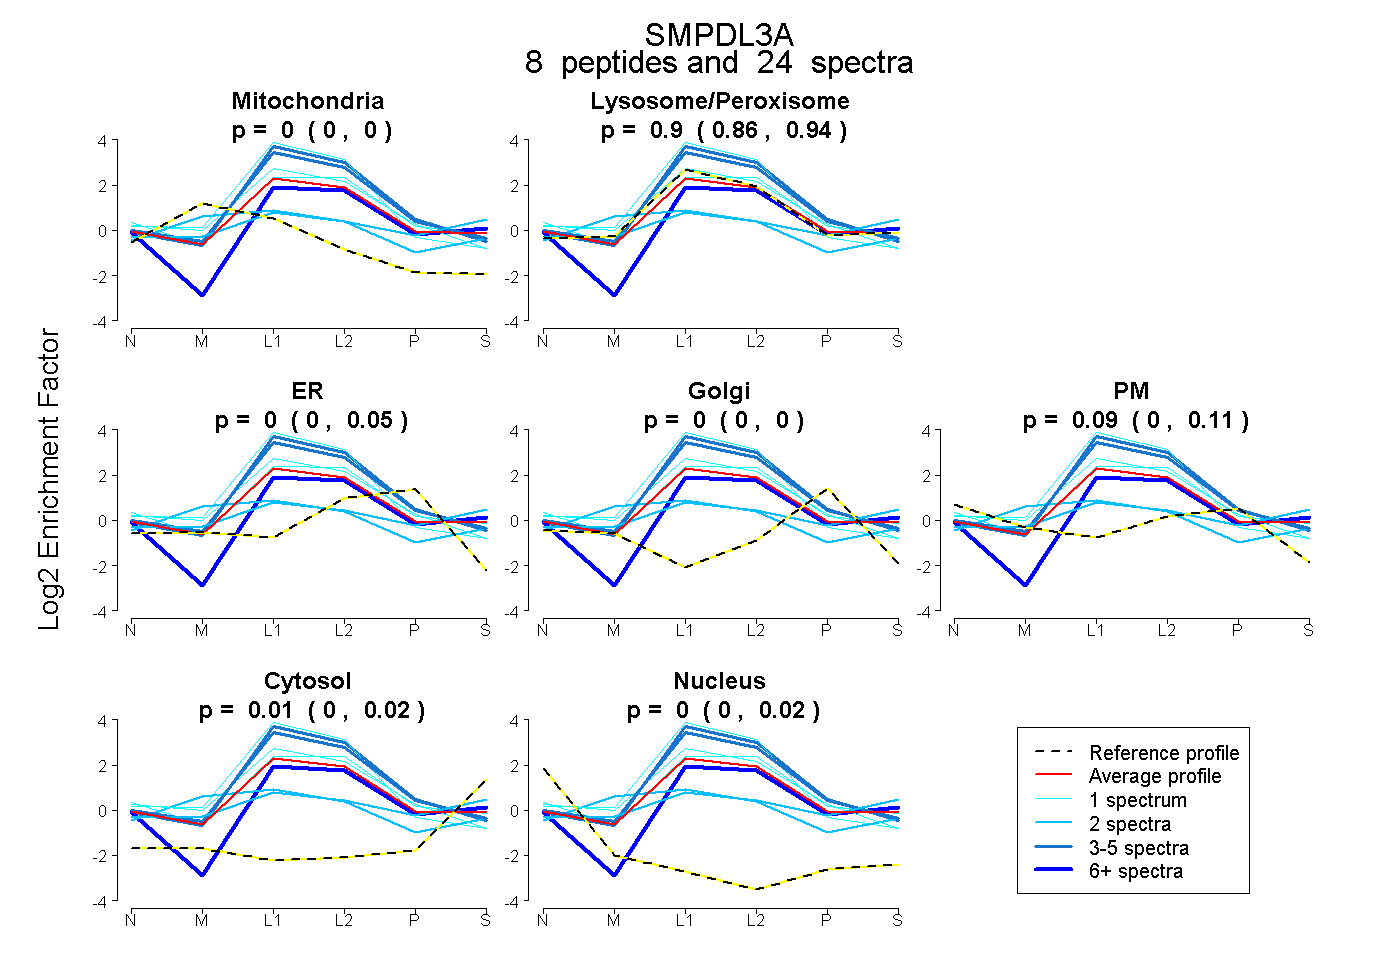 |
0.000 0.000 | 0.000 |
0.902 0.860 | 0.942 |
0.000 0.000 | 0.049 |
0.000 0.000 | 0.000 |
0.092 0.000 | 0.109 |
0.006 0.000 | 0.021 |
0.000 0.000 | 0.024 |
|||
| Plot | Lyso | Other | |||||||||||
| Expt C |
13 peptides |
292 spectra |
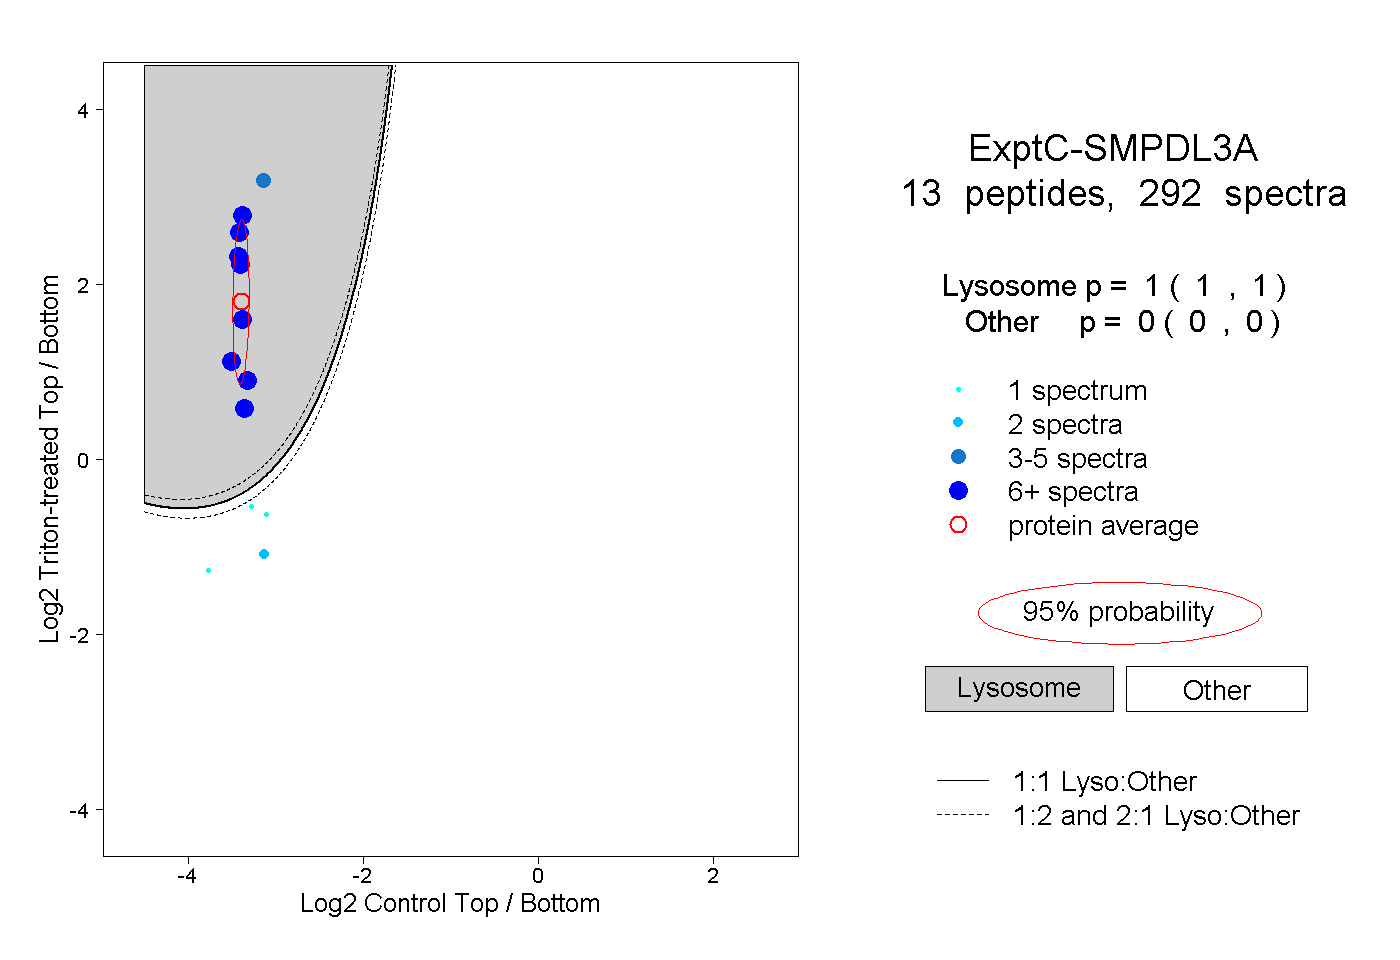 |
1.000 1.000 | 1.000 |
0.000 0.000 | 0.000 |
||||||||
| Plot | Lyso | Other | |||||||||||
| Expt D |
4 peptides |
13 spectra |
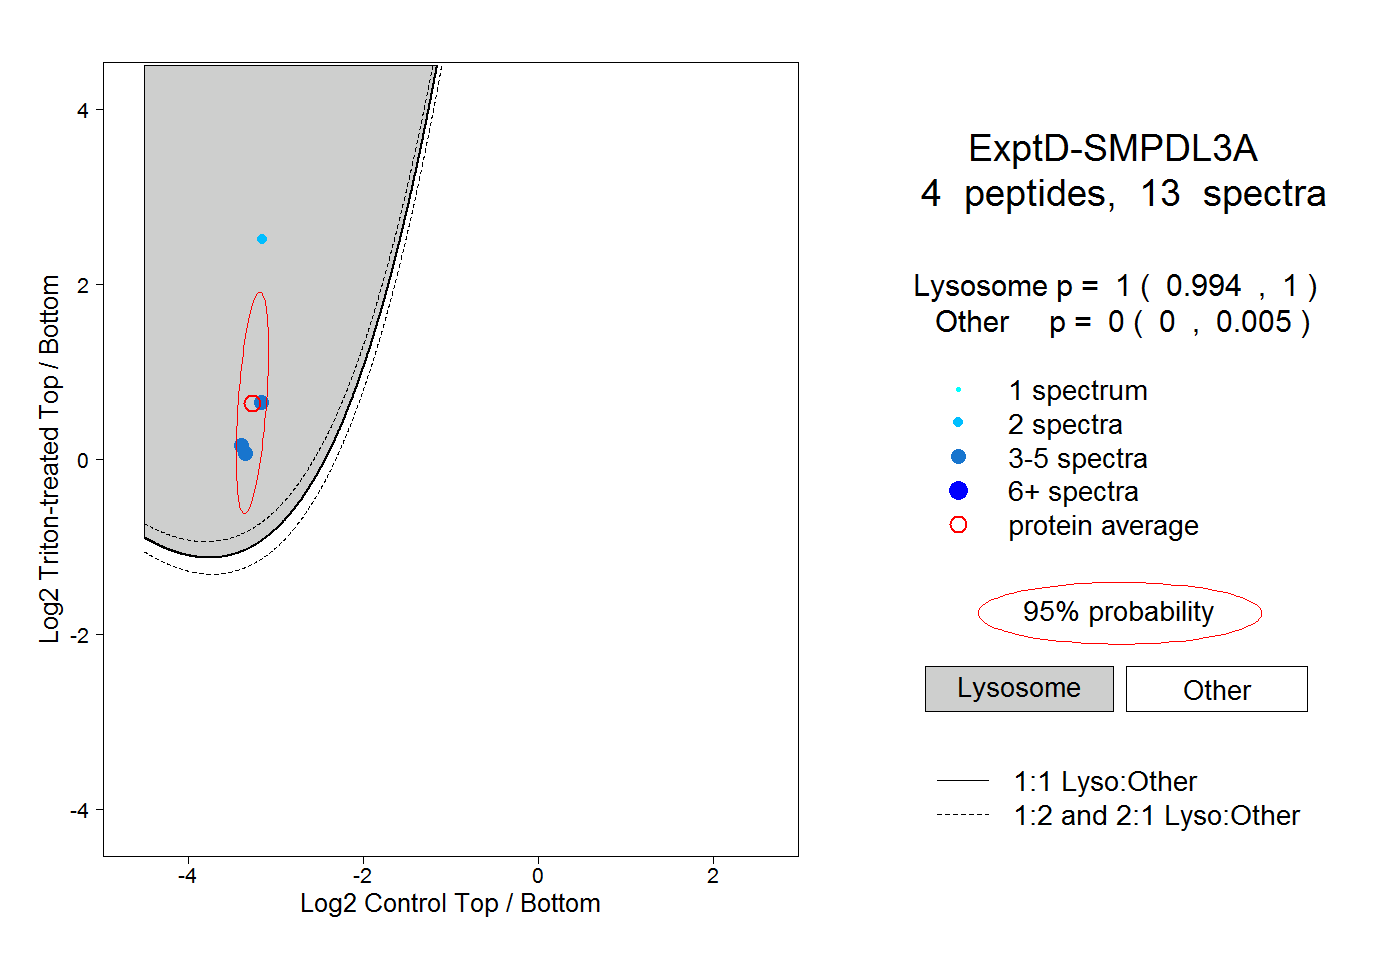 |
1.000 0.994 | 1.000 |
0.000 0.000 | 0.005 |